The usual disclaimers apply. This is our opinion and is not any more or less than that. We have intentionally avoided any deeply technical material and equations. Any inquiries should be sent to me at cdoswell@earthlink.net.
In our first Webpage discussion of this topic [WARNING: The "first Webpage discussion" is rather technical; non-forecasters and those without some college-level mathematics will find it difficult to follow.], we introduced some basic ideas of probability forecasting and the verification methods associated with those probabilistic products. As time has passed, we've been involved in many Internet discussions about probabilistic forecasting with scientists, storm chasers, a few emergency managers, and of course, forecasters. During those discussions, we find ourselves seeing the same sorts of reactions, and dealing with the same sorts of issues. It makes sense to provide this new page to summarize the sorts of things we have heard in reaction to our proposals and our responses to those reactions.
The context for our Internet discussions has been largely in the realm of severe convective storms - the products of the Storm Prediction Center (Outlooks and Watches) and the local offices of the National Weather Service (Warnings). It has been our view that many problems associated with decision-making with regard to these products were directly related to the categorical nature of the products. The SPC has been revising their product suite to make more explicit use of probabilistic forecasting methods - which we see clearly as an important step in the right direction.
a. Outlooks
The Storm Prediction Center's Convective Outlooks now have an explicit probabilistic character, in addition to the old nomenclature for "risk" (Slight, Moderate, and High). The probability graphic products available for "day-1" outlooks now include a breakdown by specific probabilities for each of the three different kinds of severe weather: tornadoes, hail, and convective winds.. The old "risk" levels had a probabilistic flavor ( now expressed also in probabilistic terms for day-2 and day-3 outllooks), but their definitions were somewhat vague and did not even have a clear consensus meaning among SPC forecasters, much less their users. In principle, these definitions were associated with areal coverage of severe weather events ... and, as such, had some relationship to probabilities (see our Primer for more explanation, as well as the references therein). However, as these categories were used, some influence was associated with the perceived intensity and type of the anticipated severe weather - high risk days were almost uniquely associated with anticipated tornado outbreaks, for example.. A day that was expected to produce a major tornado outbreak was likely to get a higher risk category than a day with an expectation of comparable areal coverage of primarily non-tornadic severe weather. Thus, the single word descriptor was being made to serve several different purposes in actual practice. Outlooks (and their verification) have evolved from their beginnings, and although the wording has changed (formerly, isolated, few, scattered, and numerous severe storms), the basic issue of trying to make a single word serve multiple purposes had not changed. The introduction of formal probabilities has largely overcome this, despite the continuing use of the one-word descriptors.
Outlook forecasting is influenced heavily by numerical model guidance, although there's considerable augmentation of that by "conventional" meteorological diagnoses (surface and upper-air charts, soundings, satellite images, etc.). This reflects the emphasis on numerical models for forecast products in the Outlook time frame. Outlooks currently are for periods from 12 to 48 hours, and their spatial coverage can be quite variable, from on the order of 10,000 square miles (~ size of a watch) to regions of order 10 times larger.
Outlooks are primarily intended for internal NWS use, with some expectation that they would be valuable for emergency managers to plan operations on days when severe weather is expected. The outlooks have increasingly become available to the general public, in one form or another, including dissemination by television and especially on the Web.
b. Watches
Severe weather watches have evolved from their beginnings as well, into a product that has basically four "flavors": the tornado (red, in SPC terminology) watch, the severe thunderstorm (blue) watch, and the Particularly Dangerous Situation (PDS, in SPC terminology) versions of the red and blue watches. The latter are designed to deal with anticipated major outbreaks of tornadic or primarily non-tornadic severe weather, respectively, where the intensity of the anticipated storms is expected to be relatively high. Including the possibility of PDS watches is implicitly a probabilistic statement.
A continuing major problem has been the distinction between red and blue watches. Given the criteria for observed severe convective weather - that is, any occurrence of:
means it is a severe convective storm, but not all severe convective storms are tornadic. This page is not the place for a full discussion of the issues tied to what makes storms tornadic (see here and here), but it is clear that we have less-than-perfect scientific and operational techniques for making this distinction. Hence, there always is some anxiety associated with the decision of red vs. blue. The "PDS" watches are relatively new, and it appears that the decision to make such a distinction is not being done infallibly, either.
It 's expected that watches cover areas of order 10,000 sq. miles and periods of about 6 h. The meteorological decision-making about watch issuance is driven mostly by synoptic- and subsynoptic-scale processes, although radar and satellite data are used heavily to augment the "conventional" data streams (surface and upper-air data and analyses). Numerical model guidance is useful but not typically the primary driver for watch issuance. Although many tornadoes (perhaps even the majority) are associated with supercell thunderstorms, not all of them are. Most of the techniques that evolved from the original methods developed by Fawbush and Miller in the late 1940s can be shown to relate to factors associated with supercell-favorable environments; thus, tornado watches have traditionally been supercell watches. This is changing as we learn more about non-supercell tornadoes and the realization that most supercells are nontornadic. If a severe thunderstorm, especially a supercell, is possible, the occurrence of a tornado is hard to rule out completely and it is just as hard to be completely certain of tornadoes.
At the moment, it's not documented to what extent it's expected that watches should be issued for every severe thunderstorm event. Informal policy in the SPC assumes that relatively isolated events, especially of a marginal nature (just barely severe, as opposed to high-intensity severe thunderstorms), will not merit a watch. In practice, however, if a marginal event produces one or more fatalities, or happens to do a lot of damage by striking a vulnerable human construction, there is some management concern if a watch had not been issued. Thus, it appears that an asymmetry in the penalty for false alarms versus failures to predict is present in the perception of the verification ... false alarms are more easily tolerated than failures to predict, especially when the failures involve significant human impacts. This asymmetry, combined with the usual meteorological uncertainty, tends to produce an overforecasting bias, and is strongly connected to the categorical character of watches. With the exception of the possibility of PDS watches, a watch is either issued or it's not - binary choice. Thus, the tendency is to issue in some dubious situations, just to avoid the unpleasant result of having serious damage and casualties occur without a watch.
Nominally, watches are intended for use by the local offices, but it has become an important vehicle for geting information to the public, as well. Many emergency managers use them in the decision to deploy spotters.
c. Warnings
Warnings are the most time- and space-specific severe thunderstorm product issued by the public weather services. The area of a warning typically is a county or some fraction thereof, and the period of validity is roughly one h. Note that warnings are forecasts ... they're a statement about expectations during the valid time of the warning. The input for making warning decisions is now largely the WSR-88D radar, with some augmentation from spotters and, in some offices, from subsynoptic scale meteorological diagnosis.
Like watches, they come in red and blue flavors, although this terminology is primarily that of the SPC, not with the local offices that issue warnings. As with watches, there is no official statement about whether or not a warning ought to be issued for every severe thunderstorm occurrence. Deciding between red and blue warnings can be an anxiety-laden process for basically the same reason mentioned above: false alarms are discouraged officially but tolerated more readily than failures to predict whenever a large-impact event occurs. Also in common with watches are the less-than-perfect operational methods for distinguishing severe from non-severe, and tornadic from non-tornadic events, and the inability to issue a product that has different levels of threat - warnings, like watches, are categorical - they are either issued or they aren't.
Severe thunderstorm events of all types are like many other meteorological events: most of them occur near the official threshold levels and the frequency drops off markedly as the intensity of the events increases. The recent emphasis on verification statistics for warnings has led to an increased pressure on getting warnings verified. Unlike outlooks and watches, the responsibility for gathering the data used for verification of severe thunderstorm and tornado warnings lies with the people who issued the products - the NWS offices. This has some potential for abuse, or at least the appearance of abuse - it appears as if the fox is guarding the chickenhouse.
Since warnings are primarily aimed at the public, it is clear that, unlike outlooks and watches, the warnings are specifically aimed at reaching audiences outside the public weather services. It has been argued elsewhere that the communities and, ultimately, the citizens have the ultimate responsibility for taking appropriate safety steps once the public weather services have issued a warning. In practice, this responsibility is effectively up-loaded to the person issuing the NWS warning, since many public decisions are driven by the specifics of the warning. However, it is also true that most warning recipients do not simply go to shelter upon hearing a warning. It appears that most of the public goes into an "information-seeking" mode, trying to confirm whether or not the threat is specific to them, personally. Those most likely to simply go to shelter upon hearing a warning, especially a tornado warning, are those who have personal experience of a traumatically intense event and have no wish to repeat that experience.
d. Some general considerations
It's widely perceived that, from an operational perspective, the best products dealing with convection are those that cover the smallest area and are in effect for the least possible time. This is the issue of space-time specificity of the products. In the best of all possible worlds, which clearly is not the real world, such a constraint might be valid. However, there are many factors that mitigate against such a view. Are a lot of small watches better than a few large ones? If the outlooks are the size of watches, doesn't that create a bit of a dilemma? If the watches are the size of warnings, isn't that another dilemma?
From the point of view of communications logistics, it seems that smaller and shorter duration is not always the best policy, at least in cases where a very space-time specific product cannot be issued with very high confidence. The lower our confidence, the less space-time specific we can be, in general terms. A blizzard of very space-time specific product might well lead to confusion, not clarity - and if the forecast products are characteristically not accurate, then that could create credibility problems. Logistically, just keeping track of a lot of small products that expire at different times would be hard for the NWS, and more so for the public.
Threat specificity of the products is yet another issue. How accurately can we assess the threat in a particular situation? Can we categorically exclude certain threats and include others?
The science of severe storms cannot escape certain unfortunate realities associated with forecasting complex, nonlinear dynamical processes. In general, nonlinear systems have limited predictability even in cases where the physical processes are perfectly known. It cannot be said that the meteorological processes creating severe thunderstorms and tornadoes are even reasonably well-understood, much less to perfection. Added to that is all our uncertainty about what is going on in the atmosphere as a result of sampling it at a finite number of points with instruments that introduce measurement errors. All of this makes it a virtual certainty that perfect forecasts are impossible, and that the accuracy of the forecasts decreases with time into the future. The farther ahead we are asked to look, the less certain we become.
However, that isn't yet the whole story. The products we have described - the Outlooks, the Watches, and the Warnings - are increasingly space-, time-, and threat-specific as we proceed down the progression from Outlook to Watch to Warning. This implies that we should be getting better as we go, but this is not necessarily the case. At each of these three different levels of specificity, the meteorological information we use changes, our level of understanding changes, and it is not obvious that predictability increases very much as we proceed downscale. In fact, it can be argued that the challenge is greater as we go downscale: Outlooks are easier than Watches, which in turn are easier than Warnings. For the record, no weather forecast is "easy". Thus, many of the implications of space-, time-, and threat-specificity are at least arguable and they may be misleading.
It's our belief that uncertainty is an inescapable fact of weather prediction at all scales. A forecast product that does not include some statement about uncertainty associated with that product is not providing the users of that product with information they need.
When we introduce the notion of using probability methods to deal with uncertainty in severe convective weather forecasting, we typically get the same sorts of objections, questions, and concerns. We suspect that many of these reactions are natural responses to the unfamiliar. This normal skepticism is not necessarily bad ... we welcome the opportunity to interact on this topic, since it forces us to think about the issues.
Probability and statistics are not necessarily the most exciting topics and most people have little or no training or experience with them. The success of "gambling" casinos (where the odds are always tilted in favor of the house) and lotteries is a good measure of the widespread lack of understanding about probability and statistics. Thus, many of these reactions are understandable, if not well-founded.
a. Accuracy of probabilistic forecasts
Presumably, human forecasters are being asked to estimate their level of confidence in their forecasts. How accurate can they be? After all, if two forecasters look at the same data, they usually arrive at different conclusions about the forecast. If a forecaster is more confident about a forecast than another, does that higher confidence always mean that forecaster's product is most likely to be correct?
b. Probability of severe events
Aren't the chances of a severe weather event pretty small? If the probabilities are realistically low, then wouldn't they convey the wrong impression to the public?
c. Public reactions to probability
Doesn't probability confuse the public? It seems that no one understands probability anyway, so why use it in public forecasts? It might be o.k. to use probability for internal discussions among forecasters, but should it be used in products aimed at the public? If we want to convey uncertainty, why not just describe it in words?
d. Giving users what they want
Severe weather is quite a bit different from precipitation. Why not just tell the users of weather information, like emergency managers, what we think is going to happen? Isn't that what they want to know?
e. ...
In responding to these reactions, we are sort of cheating. That is, we have posed the questions and we are about to knock them down, like straw men. Although we have tried to make this discussion reflect accurately what we hear people saying to us, there may well be different questions you want to ask, different objections or concerns. Please feel free to e-mail us: either at cdoswell@hoth.gcn.ou.edu or at harold.brooks@noaa.gov. If your input is of sufficient interest or generality, we may wish to include it here ... with your permission, of course.
NOTE: In the interest of brevity, we will not re-develop here the basic notions of probability that we provided in our first Webpage discussion. Rather, we will assume that an interested reader will do some digging to find out more about the concepts that we are using in what follows.
a. Accuracy of probabilistic forecasts
This is a legitimate concern. Given that subjective probabilities are relatively unconstrained - they need only obey the basic laws of probability - forecaster confidence in their product can vary widely, in general. If that were the end of the story, then using this product would be pretty dangerous, indeed. However, forecasts should be verified - that is, we should know to the best of our ability the relationships that exist between the forecasts and the observations that verify those forecasts. If a forecaster has a consistent bias for over- or under-forecasting, for example, this will be revealed by the verification.
Under the assumption that a forecaster actually cares about the accuracy of the forecasts, it is easy to see that feedback from verification will allow forecasters to calibrate their uncertainty. In effect, a substantive verification allows forecasters to compare the distribution of their probabilities against the occurrence frequencies for the events they are trying to forecast. With this feedback, most forecasters are capable of this calibration to the point where in identical situations, most forecasters will arrive at roughly the same subjective probabilities. Although we're not prepared to go into the history of precipitation probabilities, it has become apparent that forecasters are relatively good at estimating their uncertainties, although some variability exists naturally between individual forecasters.
In any particular situation, if two forecasters arrive at very different estimates of uncertainty about their forecasts, it is not true that the one with the higher confidence is necessarily correct. Suppose those two forecasters have calibrated their forecasts, and we compare their verification statistics over a large number of forecasts. It is possible that one forecaster is consistently better than the other in some aspect of forecasting, a fact that would be relevant in choosing between their forecasts in some particular situation - but the best forecaster is not always right, and the worst forecaster is not always wrong. In an ideal world, forecasters perfectly calibrated and equally skillful forecasters would generally agree about the forecast probability, at least on the average. For a given forecast, forecaster uncertainty should be a real expression of his/her thinking, but it is not a guarantee of anything
There inevitably will be differences remaining among forecasters after calibration has been done for some period. What calibration means is that the uncertainties in comparable situations are not going to be wildly different among forecasters. This has been demonstrated pretty clearly with the Probability of Precipitation (PoP) products that were introduced in NWS forecasting more than 30 years ago.
Another point to be made is that forecaster estimates of uncertainty should be guided by baseline probabilities. These baseline probabilities can come from climatological frequencies (provided the events, areas, and times used to find frequencies correspond to those used by the forecaster) and/or from objective forecasting systems (e.g., the Model Output Statistics [MOS] probability forecasts). By using these objective baseline probabilities, a forecaster has some sense of the relative threat associated with his/her subjective estimate. For example, if the forecast probability is many times greater (or smaller) than the climatological frequency, this is a pretty strong statement, whereas a probability estimate near the climatological frequency is basically a "know-nothing" forecast, because it says the forecaster is unable to distinguish the likelihood of an event on this day, compared with any other randomly chosen day in the historical record.
If we were to introduce probability into severe convective weather forecasting, it is clear that calibration, development of baseline guidance, and training should take place behind the scenes before introducing it to the public. It would be irresponsible to make the public suffer from poorly calibrated forecasts during the time of transition from categorical to probabilistic products.
In summary, we believe that forecasters are able to provide accurate estimates of event probability, provided they have had time to calibrate their forecasts against the observations via a detailed verification ... and provided they have some objective baseline probability products to provide them with some guidance.
b. Probability of severe events
If we assess the climatological frequency of severe convective events at any specific point (or small area), it is quite true that these frequencies are pretty small. For example, even in the heart of "tornado alley," a particular square mile will experience a tornado (of any intensity) on average about once in a thousand years (an annual probability of 0.001 = 0.1%). That's a pretty low probability.
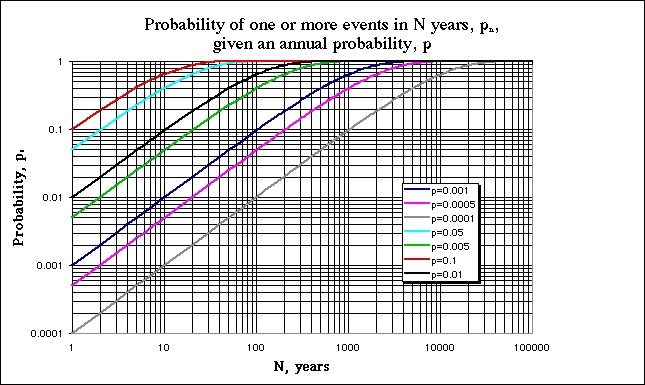
My mistake (CADIII) ... if the annual probability is p, then the probability of experiencing at least one event during a period of n years is, under certain assumptions, given by pn = 1-[(1-p)n], as discussed here ... this is derived by calculating the probability of zero events in n years and subtracting that from unity. Therefore, the probability of experiencing one or more tornadoes in 1000 years, at a location where the annual probability is 0.001, becomes p1000 = 0.632. After 3000 years this has become 0.95, and in 10,000 years has become asymptotic to unity.
This formula can be generalized for different values of p, with the following graphical result:
However, what is the probability that a tornado will occur during any given year in "tornado alley" (e.g., some large area in the Great Plains)? For a big enough area, that's a number pretty close to unity ... it is virtually certain that at least one tornado will occur in that region during the course of any given year. Similarly, if we extend the period of the forecast to a 10,000 years, the probability of a tornado in a particular square mile can be pretty close to unity, as suggested in the update, above.
Now for all of the foregoing, we have been discussing the unconditional probability of a tornado within some space-time volume. Suppose we are in a situation where a tornado is on the ground 100 yards from the area in question (be it one square mile, or millions of square miles) and moving at 60 knots toward the area? What is the probability of a tornado inside the area in the next hour? It is no longer a trivial number! What we are really talking about with these severe convective weather products is conditional probabilities ... given the situation we are in right now, what are the chances for a event? In the situations where severe convective weather products are being issued, those conditional probabilities are not necessarily small at all.
By way of illustration, consider the following two alternative scenarios for a metropolitan area (not a point!) .. at your weather office, you see either:
In case #1, the probability of a tornado in your metropolitan area in the next hour is not zero (zero would be reserved for "severe clear"), but it isn't extremely high. Given that you have a weakly rotating storm nearby, that probability should be higher than the climatological frequency (per hour) for your metro area - having such a storm in the area is not a climatologically common experience. It's not impossible that things could change rapidly for that storm; for example, it might encounter a boundary, rapidly develop a deep mesocyclone, and go on to produce a tornado in the next hour. You certainly would not want to tell people that the tornado probability is zero and it's well above the climatological probability (which would be quite small), but you certainly would not be inclined to tell them a tornado is definitely going to happen, either. The challenge to a forecaster using the existing categorical warning method is that the forecaster can decide only on a yes/no basis, in the face of the asymmetric penalty for a failure to issue a warning in comparison to that for issuing a warning and having nothing happen.
In case #2, the probability of a tornado in your metropolitan area within the next hour is not unity, but it certainly could be close to that. You'd be ill-advised to issue a 100% probability, though; there are too many things that could prevent a tornado in your metro area in the next hour. The tornado could dissipate suddenly, the storm could encounter an outflow boundary and veer away from your metro area, the whole storm could collapse in the next hour, and so on. Nevertheless, in such a situation, you'd be justified in believing that the threat is much greater in case #2 than in case #1. The probability would provide an unambiguous indication of your relatively high confidence in case #2. Again, however, your only option is yes or no - in this case, it is pretty clear that the decision should be to issue the warning, but not all such warnings would verify.
We think it would be useful to the users of warnings to have probabilities to help them understand the confidence forecasters actually have about anticipated events in such cases (and those in between the very different situations just described). Presumably, a "warning" product would only be issued when the probability reaches some threshold, but the threshold need not be unity and the forecast need not imply that it is!
c. Public reactions to probability
We certainly have to concede that most people in the public are naive about probability. We certainly admit that confusion is rampant today about the meaning of PoPs, even within the NWS, to say nothing of the public. However, many studies have shown that the main confusion about probabilistic forecasts is associated with a lack of clear knowledge of the event being forecast. With respect to PoPs, people are confused about whether or not it's a probability of a rain event within their backyard, or a rain event within the 8 inch rain gage at the airport, or if it refers to the percent of the area that's going to experience rainfall, or whatever.
In essence, then, we need to be very clear about defining our events if we are going to use probability in forecasting. Public education and awareness campaigns would be needed prior to introducing probabilistic severe convective weather forecasts, so that everyone would be as aware as possible of what "an event" means when we talk of the probability of an event. This does not seem like an insuperable obstacle to overcome, although we do not want to trivialize this process. It would take a significant effort, make no mistake, especially for warnings, which are manifestly intended primarily for the benefit of the general public. Changing the system tends to make forecast users uncomfortable, because it alters a part of their world .. but some change is inevitable and in today's technologically-dominated cultures, change is considered one of the few things that are permanent. If we are going to change, we should be certain that it is beneficial - and we believe that probabilistic forecasts and warnings will be beneficial.
Where users have no confusion about probability is in deciding that 80% is a higher probability than 20%! Studies have shown that giving verbal descriptions of uncertainty (e.g., "chance of rain" or "rain is likely" or "possible rain") is vastly more confusing to the public. Interpretation of words varies considerably from one person to the next, no matter how precisely the NWS might choose to define what "chance of" means. There can be no ambiguity of the relative confidence in an event when using probability. Although even many scientists are on shaky ground when using probability theory, it is quite possible for users of probabilistic forecast products to be capable of making effective use of probability without being even remotely competent in using abstract probability theory.
Note that "the public" (or the set of all weather information "users") is not some sort of monolithic block. Rather, it comprises many diverse interests and perspectives. Many citizens have little or no real interest in the weather (apart from casual conversation), except on the rare occasions where the weather has a significant impact on their lives. Then they may have some expectations of how those events will be handled and those expectations can be quite unrealistic. Other users make use of weather information on a daily basis and have developed quite sophisticated mechanisms for including that weather information in their decision-making process. It is our belief that we should not create weather information products for the lowest common denominator within the "public." In order to avoid problems with the lowest common denominator, the information content tends to be reduced to the lowest possible level. This "dumbing down" reduces the value to the more sophisticated users.
It is relatively easy to "dumb down" a product from a more complex version, but it is difficult (if not impossible) to go the other way. The SPC convective outlooks have incorporated probabilistic graphics that are valuable to the relatively sophisticated users while retaining the old more or less categorical products (outlines of slight, moderate, and/or high risk). We believe that severe convective weather products could go through a series of more or less automated procedures to take them from their most complex level right down to the minimalist product that would even reach the lowest common denominator. If we've imposed the lowest common denominator view at the highest level, we offload this task to the users who need something more complex to try to make this simplistic product useful to them. We end up ignoring the sectors of the public that are most interested in meteorological information in order to satisfy those segments that are least interested! We believe this to be a mistake and a disservice to the diverse spectrum of users.
The use of weather information involves decision-making. Should I carry an umbrella to the office? Should I pour that concrete today? Should I invest in orange-juice futures? Should I dust my crops? Should I gear up my powerplant for a heavy load tomorrow? Should I send my staff to shelter? Do I need to check on my emergency kit's supplies? There are many individuals and businesses that are very sensitive to weather information - the effect of a good forecast may be really important at certain times and places, especially when it comes to severe convective weather events. However, for all the decisions that need to be made, weather information is only part of the story in every case. Every user has a more or less unique set of issues that affect decision-making. Thus, the response to a given weather input varies considerably among users and only the users themselves are aware of all the nonmeteorological issues governing how they should respond in a severe weather situation.
As a simple example, compare someone living in an underground home versus someone living in a mobile home without tie-downs and no nearby shelter. The reaction to a threat of severe convection differs substantially between these two, even though the weather input is identical. The one user has a different threshold for action than the other, owing to factors about which the NWS would know absolutely nothing. If it were known that the forecast had a certain level of confidence, as opposed to a categorical threat, it seems plausible that both users would benefit from that knowledge to make decisions in accordance with their own unique situations. The NWS wouldn't have to issue warnings to save the most vulnerable section of the public - they simply would express their expectations and the confidence level in those expectations. In effect, the NWS would no longer be expected to make decisions for all their users - an impossible task, given that the NWS cannot know all the decision-influencing factors for all their users.
d. Giving users what they want
The relationship between forecasters and users has been discussed in some detail elsewhere. For purposes of this discussion, we want to reiterate a point we just made: the "users" are not some monolithic block. Given that our meteorological community has been slow to recognize the importance of considering the societal impacts of weather forecasts, it's not surprising that relatively little is known about what users really want/need. Everyone in the field seems to be full of opinions, but it is not obvious that those opinions have been validated by a large number of carefully-crafted studies. We certainly have not done those studies, but then again, we're not claiming to speak for users.
One of use (CD) spent three summers in a local weather office and, among other things, answered phone calls from the public. Many times, callers were requesting some specific piece of information, but when questioned about why they needed that specific information, it turned out that they really didn't need that information at all, but in fact needed something else that was very different from what they asked for. The users didn't know enough to ask the right questions. This is not intended to denigrate users, but rather to illustrate that a good relationship between forecasters and users (such that the users obtain what they need and forecasters have the satisfaction of serving those needs) is one that requires some interaction. Communication with the users is necessary to try to reconcile what we have with what they need.
We often hear comments that amount to "Don't give me that probability garbage! Just tell me whether or not it's going to rain in my backyard!" If forecasters could do that with 100% accuracy, it might indeed be a wonderful thing to do (albeit, a potential logistical nightmare, depending on how we handled it). Irrespective of what the user wants or needs, however, forecasters are not always able to give users that particular product. More to the point, forecasting is far too uncertain to be able to tell someone a categorical response to this sort of request. Thus, it seems reasonable that an important part of introducing probabilistic forecast products is to get the users involved. We need to meet with some representatives from the diversity of the "public" and work together with them to convince them that:
In deciding what the final products are going to look like, we believe it's important to get input and suggestions from users and, at the same time, to help them learn about the limits on what we can do. Along the way, we should accept the responsibility to help them satisfy their needs from what we are able to provide. A convinced user becomes a salesperson for our products. And we can produce forecasts that we have some confidence are actually useful to someone, because we would have direct contact with those users. Obviously, particular users may not be satisfied .. after all, it is a diverse group. Pleasing everyone is impossible.
At present, we have done far too little to be responsive to user needs, in our opinion. As we have just noted, serving users is not equivalent to giving in to their every request.
e. ...
As long as we're considering probabilistic forecasts, let's also consider putting the observed severe weather reports into a probabilistic format! There are several levels of uncertainty associated with the reports. Doswell and Burgess (1988 Mon. Wea. Rev. - available here) recommended that the source for severe weather reports be included in the log. To date, this reasonably simple suggestion has not been implemented, for reasons that escape us. It may be that this idea lacks a "champion" in the NWS hierarchy ... Fujita's idea of F-scales was implemented as soon as Allen Pearson (then head of the SELS unit - the predecessor of the SPC) got sold on the idea (perhaps because he was involved with it, as in the "FPLPW" scale ... the P-components have since fallen into disuse). With source information, it might be possible to attach a confidence level to the reports.
If a tornado is observed by someone knowledgeable and reliable, like Al Moller or Gene Moore, that report should get a high confidence level. If a detailed survey is done by knowledgeable folks (not the typical white-wash bureaucratic report, but a real scientific survey! - see Speheger et al. 2002 Wea. Forecasting - available here), that should enhance the credibility of a report. If a wall falls on some people in New York state and political pressure is put on the system to call it a tornado, this sort of report should get relatively low confidence. The idea is that the source is associated with varying degrees of credibility.
Many things could be done to develop a system for assigning confidence levels to the severe weather reports, but without adding the relevant source information to the log, it is difficult to imagine how this could be done systematically and routinely. As it now stands, all reports have equal credibility by the time they make it into the database. On the basis of what information we have, the reports can either be accepted or rejected ... and in general we have no basis for rejecting them.
Since local offices who send in the reports must know where they came from, it should be simple for them to add information about the source at the time of the report, when the source information is still "warm". Often, this information gets written down on scraps of paper, which disappear by the time the report gets sent in to Storm Data, or whatever. Source identification could be as simple as selecting from a list, perhaps something like:
Some sources might fit into several different categories. It would also be interesting to know how many events are surveyed, and who did the survey. With a little imagination, there are many questions one might choose to ask of the database if the source information were available. In the current day, it shouldn't be all that difficult to make this desperately-needed addition to our severe events database.
Just as important to establishing the credibility of reports is the credibility of non-reports. It is just as important to assign confidence to the non-occurrence of a severe weather event. Consider the following scenarios, all of which are associated with a non-report:
The non-report in each of these cases should have a different probability of being a valid instance of a non-occurrence of a tornado (or any other severe event). We have the tools (and data) to accomplish the transformation of our severe storm data base in this way, but it would take a major effort to put the pieces together properly and, to date, we have trouble getting the resources for an occasional decent scientific survey after a major tornado event! Just archiving the flood of data that passes through NWS offices on a daily basis would be a huge step toward accomplishing this end, because we need those data to assess our confidence in non-reports. We'll leave it up to you to imagine other issues and scenarios that would alter the probability of reports and non-reports being valid. Until there is a will to provide a database with scientific integrity, trying to improve our severe weather forecasts is nearly hopeless!!
In any case, at the end of the process, for verification, we would have a contingency table that would be N X M: there would be N classes of forecasts/warnings and M classes of observed events. For each major class of event (tornado, hail, wind), there might be a set of probabilities running from 0 to 100 percent in some grouping (that would have to be determined). This set of probability categories, pi, might be as simple as
p1 = 0.0 0.0 < p2 < 0.1 ... 0.9 < pn-1 < 1.0 pn = 1.0
or it might be some distribution such that there was an equal number of categories above and below the climatological frequency, or the distribution of probability categories might satisfy some other requirement that we might impose on it.
We could also subdivide the event categories:
and forecast the probabilities in each event category. Or we could forecast the probability of an event meeting or exceeding various thresholds. There are many different options. Thus, the N forecast probability classes could develop into a significant number of categories, depending on how we want to "slice and dice" the categories. We believe that it would be wise to start simple and add complexity later.
For the M "observed" categories, these would contain the probabilities that we have actually observed the events (related to the probability that the events were properly not observed). The distribution of probability categories could be the same as those used to forecast them, but it is not necessary that they be so. Again, simplicity would be the right way to start doing something like this. To illustrate what an N X M table might look like:
|
|
|
Observed (x) |
|
|
|
|
|
|
|
|
|
|
|
|
|
|
|
|
|
|
|
|
|
|
|
|
|
|
|
|
|
|
|
|
|
|
|
|
|
|
|
|
|
|
|
|
|
If the forecast categories fi look like the earlier table of hypothetical probability categories pi, then the observed probabilities xi might look the same, in which case N = M. Alternatively, the M observed categories could be something different, with either M > N or M < N. For instance, we might choose to put the probability of the observation being one of an occurrence into 3 categories: x1 implies a probability of occurrence (p) being 0 < p < 0.2, x2 meaning 0.2 < p < 0.8, x3 meaning 0.8 < p < 1.0. We might choose to develop the observed xi in this way for some specific reason, based on our ability to estimate the probabilities. Our table would therefore be N X 3.
Verification of the forecasts would involve looking at the information contained in the N X M contingency table, rather than a table where M = 2 (either the events were observed or not). We believe that in spite of the additional complexity associated with having the events be uncertain, as well as the forecasts, we can get a better idea of forecaster performance from this approach. If there are doubts about an event actually having been observed (or not observed), then a forecast verification should account for those doubts when scoring - the present system fails to do this and a dubious hit (or a dubious non-hit) counts the same as one where the event report (or non-report) is fully credible.