The standard disclaimer applies here ... this work is solely the opinion of Chuck Doswell and does not represent any sort of official statement by NSSL, ERL, OAR, NOAA, DoC, or the President of the United States [now you know what used to be my chain of command (or at least the acronyms!)].
Arguably the most common item of casual discussion is the weather, and these days a lot of discussion, including on the Internet, centers around what "strange weather" we've been having lately. The putative weirdness of the weather is attributed variously to the Jet Stream, the Greenhouse Effect, El Niño, volcanic eruptions, alien visitors, the imminent end of the Universe, and so on. A lot of this has its origins in such sources as newspapers, Sunday supplements, popular science magazines, tabloid papers, and of course, the television. Within the latter, programs about the weather appear within fairly serious presentations on PBS, in commentary and features by your local weathercasters, in the TV versions of magazines and tabloid newspapers, and on The Weather Channel. I am going to say straight up that the vast majority of what you read and hear in terms of "explanations" via the various media is fabrications, mythology, gibberish, or grotesque oversimplifications. No matter how many reputable folks they trot out in front of the cameras to capture the inevitable "sound bites" that television uses in lieu of content,[1] what the media present is mostly fluff and half-truths. The media are not in business to do science ... they are in business to sell beer, automobiles, cosmetics, toothpaste, fast food, and perhaps themselves. If good substantive science sells, that's fine, but there is a tendency to push toward the controversial and sensational, almost always at the expense of substance. The programming is mostly an excuse to put their products in front of you, the "consumer." If they happen to say something educational, it is mostly coincidental. Let the buyer beware.
Science tends to bore folks because it requires careful thought and attention. Most folks watching television, or thumbing through the mags on the local newsstand, or even surfing the Internet get bored easily. They don't want to think very hard or very long. Thus, they are easily mislead by the hype and exaggeration, lies, and mythology they encounter about the weather. If I haven't offended you so far,[2] you must be interested in substance at least a little. Let's get after the topic, now.
Most folks view the world through egocentric eyes; they act as if their own personal experience is representative of the entire planet's experience for all time. For many, if they personally have not experienced something before, it must be an unusual and abnormal experience. This is so silly and superficial, it almost does not deserve mention here, except that many folks share this kind of implicit assumption about their experience. Whenever the weather exceeds someone's range of experience (and folks tend to have short memories, so their perception of their experience is often limited to the last few years), then it is loudly proclaimed as something "abnormal" or unusual, often tinged with dire forebodings about the future.
Of course, when you read and hear about the weather from the media, you often are told what is "normal" for that day ... the normal high temperature, the normal low temperature, and perhaps the normal amount of precipitation for the year up to that date. Thus, you are given "information" that represents what is "normal" on any particular date for your town. Have you ever thought about what those numbers mean? Where did they come from? What do they tell really tell you about what to expect on April 5th, or October 23rd, or whenever? What does it mean to experience "normal" weather on a given day, or during a given year?
As I shall hope to show, the word "normal" is perhaps an unfortunate word choice that conveys something quite inappropriate when the word is used to describe the weather, especially in quantitative ways.
I begin by considering what the data might actually show .. that is, the hypothetical and theoretical. Imagine that there exists a record of high temperatures for Hellmouth, Nevada that is complete for a period of 100 years. For each date of the year (except February 29th!), there are 100 high temperature values recorded. What do you suppose such a record might look like? Do you suppose all the high temperatures on every June 16th over that 100 years are the same? This seems rather unlikely ... no one would be so stupid as to believe that, right? A nice way to visualize what the 100 observations look like would be to display the 100 high temperature observations. This can be done in a variety of ways, but imagine a plot of the number of times each temperature occurred on June 16th. Such a plot could look like this[3], from which you might recognize the familiar, bell-shaped curve. Curiously, the bell curve is sometimes called a "Normal Distribution," largely for historical reasons that are of little interest here. The data might also look like this, perhaps on another date at the same location, or at another location on the same date.
Now consider how to go about defining what is normal for a particular date, given that the temperatures on that date vary from year to year. Perhaps the most logical beginning would be to say that what is normal is the simple average of the data from each of the 100 samples. The simple average (or mean ) for some variable, x, sampled 100 times is defined to be
where the xi represent the individual values from each of 100 years in the period of record, and the funny symbol is read as " the sum from i =1 to 100 of the xi".[4] The simple average is one of a number of ways to measure what is technically known as "central tendency." Another such measure is called the median ; it is that value of x that divides the distribution into two equal halves with 50 values above the median, and 50 values below. For the two bell-shaped curves just considered, the mean and the median are precisely the same; the simple average is co-located with the peak of the distribution. This is not always true, as will be shown later.
These first two examples have been chosen such that the simple average of the data is the same value in both, but clearly the distributions are quite different. It appears that the range of values is much greater in the second example than in the first. This is an important lesson about what is meant by "normal": the simple average value does not tell the whole story ! Since the total number of values must remain the same in both cases (e.g., in my hypothetical example there are 100 total high temperature values for each date), the average value occurs much less frequently in the second example than the first. In fact, even in the first example, the average value does not occur the majority of the time ... most of the values in the distribution are not precisely on the average value. This is generally the case, so if "normal" is defined to mean that there is no departure from the average, then what is normal is actually somewhat unusual! In other words, if by "normal" we mean the average, what is "normal" actually only occurs once in awhile. The figures show that the occurrence of the average value is more unusual in the second example than in the first, but large departures from the average are less common in the first example compared to the second.
This is already illustrating another important issue. If by "normal" we choose to mean what is typical , then what is really typical is variation. The weather varies from year to year, so the average by itself just doesn't say very much about what the real weather is like; the average is just a statistical result derived from a collection of events that individually may not look anything like the average. To say anything meaningful about the weather, its variability must be described .
In fact, any statement about what is "normal" without some description of the distribution of departures from normal is incomplete and misleading. In order to express the variation about the mean, statisticians often use the sample variance, s 2, defined as
where the divisor is 99 rather than 100 for some minor technical reasons that do not concern us.[5] When the distribution is narrow, as in the first example of the bell-shaped curve, the variance is relatively small; when the distribution is wide, as in the second example, the variance is relatively large. Some weather variables have more variance than others and the variance in some variable at a particular location can be quite different than at some other location. For instance, temperatures near the poles or near the equator don't vary as much from day to day or year to year as places in between. The weather in some parts of the country is more variable from year to year than in others. And the variability depends on the season. In winter, in North Dakota (for example), the temperatures don't vary by as much as they do in, say, Oklahoma. But in summer, the situation is reversed; summertime temperatures in Oklahoma don't vary as much as those in North Dakota. There are meteorological reasons for this that are not of concern for this essay. I will show data for both North Dakota and Oklahoma city later.
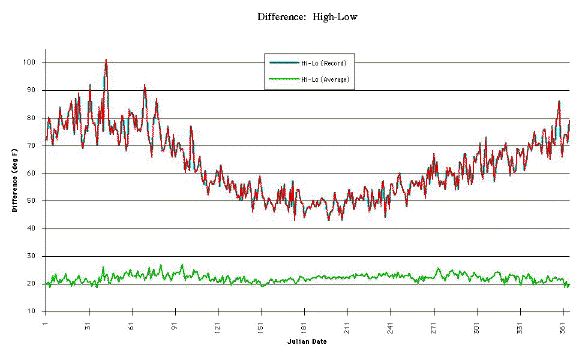
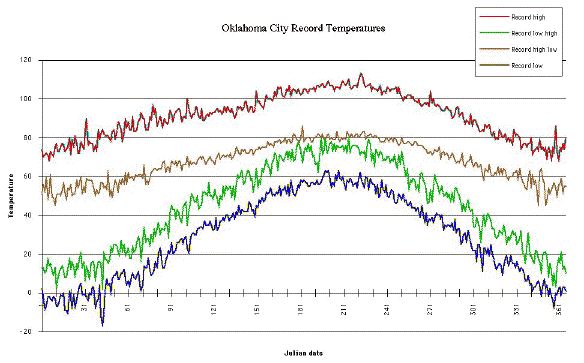
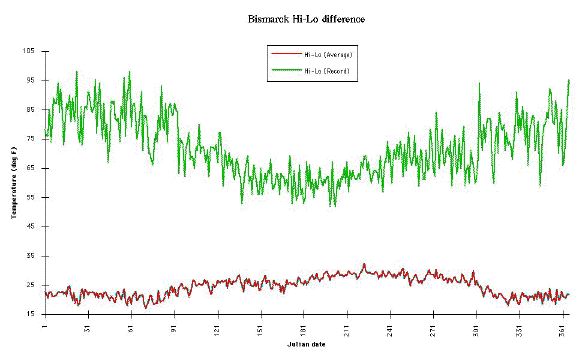
The sample variance is not the only measure of variability. There are many different ways to describe the variability via statistics,[6] but it is of some interest to consider the range between extremes. Consider some real data for Oklahoma City; shown is a plot of the difference between the record high and record low for each date in the year. Also shown is the difference between the average high and the average low, where the average is over the 30 year period 1961-1990 (this will be discussed later). As time goes by, of course, records are broken. This means that the range of observed values will gradually increase, although the underlying distribution (About which no solid information is available because it has not been observed!) may not be changing. In other words, even if the underlying distribution is constant (and there are no guarantees that it is), having observed the weather for 100 years may not be long enough to sample the true extremes of the distribution. This is a major part of the dilemma in trying to determine whether or not the climate is changing. Climate is basically a statistical product, derived from the variations of the weather . [For a different view, see the Note added in section #9] Given that our scientific observations of the weather have only been collected for roughly 200 years in the U.S., it is quite unlikely that the true climatological extremes have been observed. It is basically impossible to be certain about possible changes of the climate when the climate itself is uncertain! I'll return to this topic later.
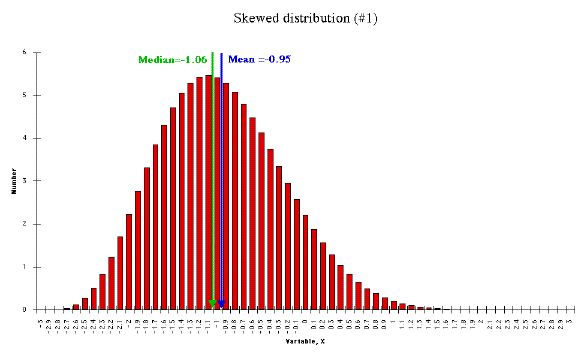
As if this isn't bad enough already, there is no guarantee that the real data will follow a curve like the first two examples. They might well look like this, where the distribution is said to be "skewed". For skewed distributions, it should be clear that the simple average is not necessarily a good measure of central tendency, because it is going to be influenced by a few large departures, far from the peak in the distribution. For skewed distributions, the median is a better measure what is "typical" is desired. In an extreme case, as with most distributions of precipitation, which look something like this; the peak is at one of the extreme ends of the observations and the distribution tails off as the observed values become large. In such a case, what is "typical" is zero precipitation. The median may be very close to zero and the mean may be inordinately influenced by a few extreme values. For such a distribution, the whole notion of central tendency becomes questionable.
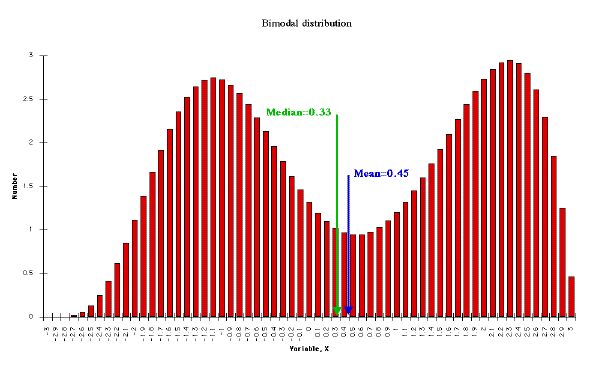
For a bimodal distribution, there is a real challenge ... neither the median nor the mean will show what is "typical" since there are two versions of what is typical, not just one. No single measure of central tendency can describe this sort of distribution. When the observations show a bimodal distribution (or even more than just two distinct peaks), this means that the weather typically tends to fall into two (or more) distinct patterns. Such distributions actually can arise, although the real distributions may not be as clearly bimodal as the example; they may simply have some "bumps" that indicate the possible presence of separate peaks.
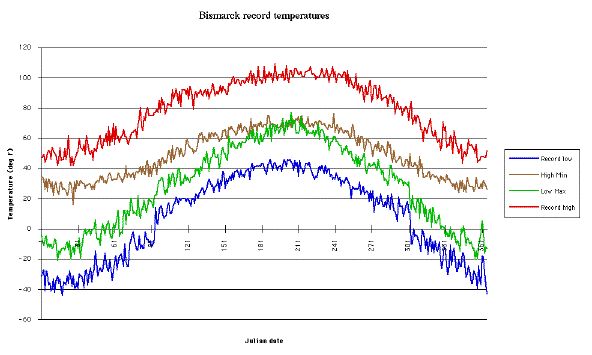
So far, I have been considering mostly the distribution of the variable on a single date, over the 100 years of a hypothetical example. Consider how the data might look when considered over the whole year. It is of some interest to look now to some real data. Consider this plot of the range of daily record temperatures as derived from the records for Oklahoma City for whatever the period of record is at that site. In addition to the regular high and low temperature records for each date, there also is is a lowest maximum temperature and a highest minimum temperature for each date, as shown in the example. Note that there is no information contained within this plot about what the distribution for each date might look like ... just the range between the record high and low for each date. You can see that there is a fairly smooth background variation of the distribution during the course of the year. This reflects the fact that temperatures are warmer in the summer than in the winter, in general. But not every day in winter is cold and not every day in summer is hot. The record low maximum temperatures, in fact, more closely resemble the record lows and the record high minimum temperatures look more like the record highs. The reader might want to think about what this says about the meteorology.
It is common practice to find the mean temperature for the
day, ![]() as the simple average between the
observed high temperature and the observed low temperature; that is,
as the simple average between the
observed high temperature and the observed low temperature; that is,
I hope at this point that it will be easy to understand that defining the mean temperature for the day in this way might not be very representative of the simple average of all the temperatures observed during the day. For instance, it may be that the maximum temperature on a particular date occurs shortly after midnight, with a cold front bringing falling temperatures throughout the day. In such a case, the day's highest temperature is not very representative of temperatures throughout that day. However, the advantage to this method for computing the day's "mean temperature" is that only two values are required: the day's maximum and the day's minimum. Obviously, done in the more complex way, the average would depend on what the distribution of temperatures during the day actually was. For a lot of the observations used in the determination of climate, the observers do not collect hourly temperatures (as is done at National Weather Service observing sites). Rather, they only measure the daily high and low temperatures. This practice, therefore, is merely a reflection of the data available. A more accurate procedure cannot be used because the data needed for a more accurate representation simply are not there at many sites.
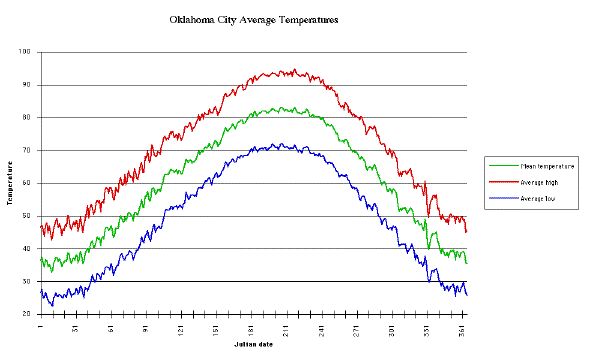
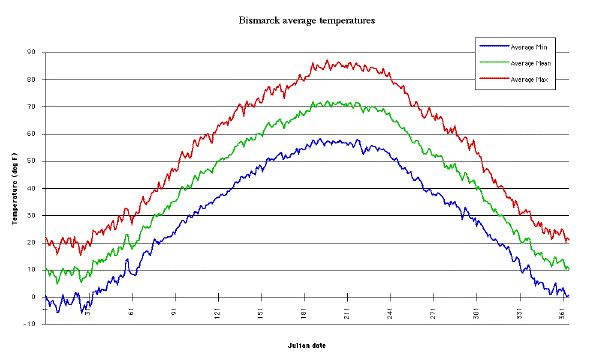
Given all this, now consider the average of, say, a 30-year period of record for temperatures, the 30-year average maximum temperature, the 30-year average minimum temperature, and the 30-year average of the mean temperature for the day. If these values are plotted over the course of a year, the result is shown on the plot shown here. This is a much smoother version of the annual variation of temperatures than the plot shown earlier (for the record temperatures on any given date), but it still has some irregularities.
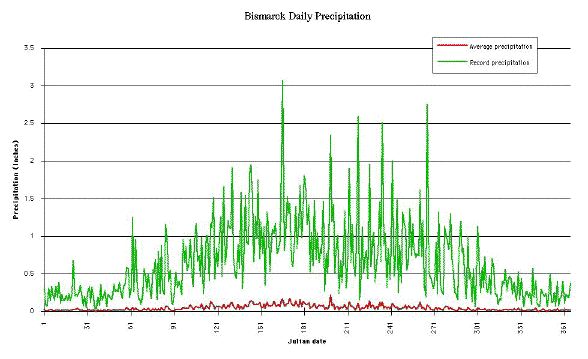
For comparison purposes, I have included some record temperature, average temperature, temperature difference, and precipitation plots for Bismarck, North Dakota.
If just the plot of the mean daily temperature is considered, the daily values of this statistical calculation could be used to define what is "normal" for each date. Observe, however, that there are some "bumps and wiggles" on this plot; the average does not change smoothly from one day to the next over the whole year. Therefore, what could be done is to calculate a theoretical curve that fits the observations closely but which does vary smoothly from each day to the next. Various technical schemes exist for doing this, but the details don't matter here. The values from this smooth curve also could be called the "normal" temperatures. The very same thing could be done separately to the daily high temperatures and to the daily low temperatures. This would yield smooth curves of the averaged high and low temperatures for each date. I hope you can see how artificial such a "normal" value is; it is the end product of a number of assumptions and statistical manipulations. It would be "typical" only in a very limited sense. Nevertheless, this process (or something like it) is basically what has been done to provide you with the "normal" high and low temperatures you see in the media presentations.
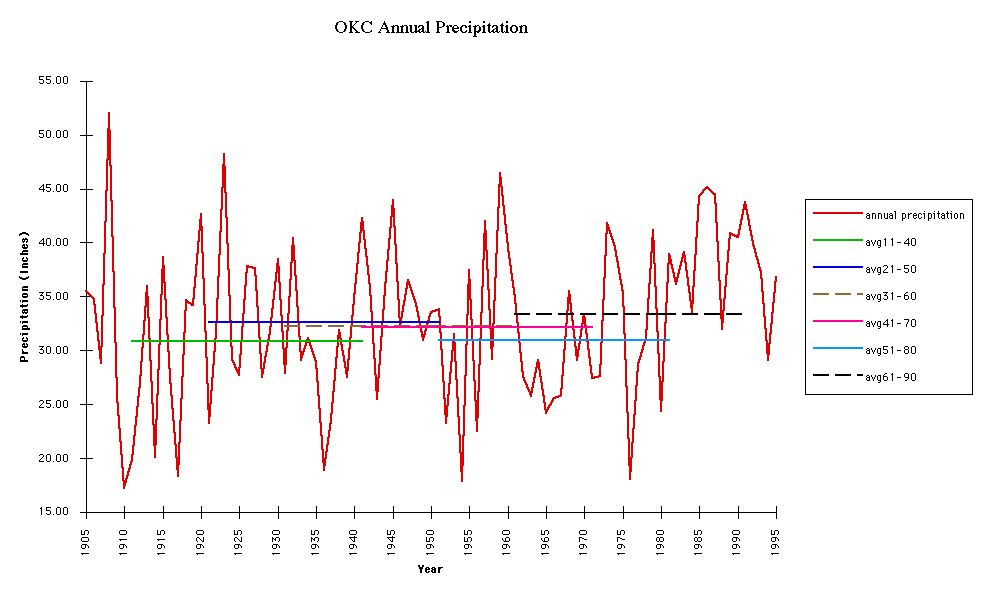
Of course, there is nothing magic or sacred about how this was done. At every step along the way, decisions have been made about how to manipulate the observations. Among these decisions is the period used to define what is "normal.". What generally is done is not to use the entire period over which data exist, but to pick a 30-year period of record and call that the period of "normal" weather. For the National Weather Service "normals" the current period of record is 1961-1990. At the end of each decade, the 30-year averaging period is moved forward another 10 years. When the data have been collected in the year 2000, the period of normality will shift to 1971-2000 in the year 2001, and stay there until 2011, and so on. The result looks like this when applied to the annual precipitation data for Oklahoma City. Note that the level lines, representing the 30-year averages for different 30-year averaging periods, change from one decade to the next. In some cases, the difference is quite significant; for the data shown, the annual "normal" precipitation for Oklahoma City has changed by as much as 3 inches!
Thus, what was called "normal" 30 years ago is not what is called "normal" today! Who decides how long an averaging period to use? Who decides which years to use? Who decides what statistical manipulations of the data to employ? For the U.S., such decisions are made by the National Weather Service and the National Climate Data Center. Presumably, if they are asked, they can provide details about how they compute what is "normal," but all such decisions are in some sense arbitrary. They could have done them in some other way and the result might have been somewhat different but equally justifiable.
So where does this leave us? As I have shown, departures from normal are not unusual ... in fact, departures from normal are quite typical. Depending on what is being observed and how accurately it is measured, we may not even have much solid information about what really is "normal" for some event. It is likely to be quite normal for noteworthy events (in terms of their departure from the average) to occur within a 30 year span, major (larger departures from the average) events to occur in every century, and even bigger events to happen in 1000 years. Given the fact that most people have the "egocentric" view of climatology described in the Introduction, each important event that departs significantly from the average will seem wildly abnormal to most people, even though in a very real sense can be considered quite typical when the long view is taken.
This brings up the often-misunderstood topic of recurrence intervals. Its most common application is to rainfalls leading to flash floods, but the method can be used to estimate recurrence intervals for virtually any event. For flash-flood producing rainfalls, the observations of rainfall over some drainage basin (or catchment) can be used to determine the frequency of peak rainfall amounts within the basin. Suppose the rainfall measurements are broken down into categories (say, intervals of 0.01 inches or 0.05 inches or whatever) and the observed occurrences within each interval are counted. This results in a frequency plot (histogram) that would look something like the one shown earlier, with a peak at the lowest values and a tail with very low frequencies extending toward high values. The frequency of events decreases as the amount of observed rainfall increases and it turns out that such plots often can be approximated very well by what is known as a Lognormal Distribution. In fact, the hypothetical plot shown is a Lognormal distribution.
Of course, really large amounts of observed rainfall are very rare and may not have been observed during the period of record. If it is assumed that the rainfall distribution found using the short period of record is applicable to very long periods, the theoretical distribution can be extended (such an extension is called extrapolation ) to find out the hypothetical occurrence frequency for very large (low-frequency) rainfall events. I observe that the process of extrapolation is a risky business. Assuming that a single sample of 100 years worth of data (or whatever is actually available) is a sufficient database to observe the real distribution of events is not necessarily a good one ... but in the absence of information, it may be all we have.
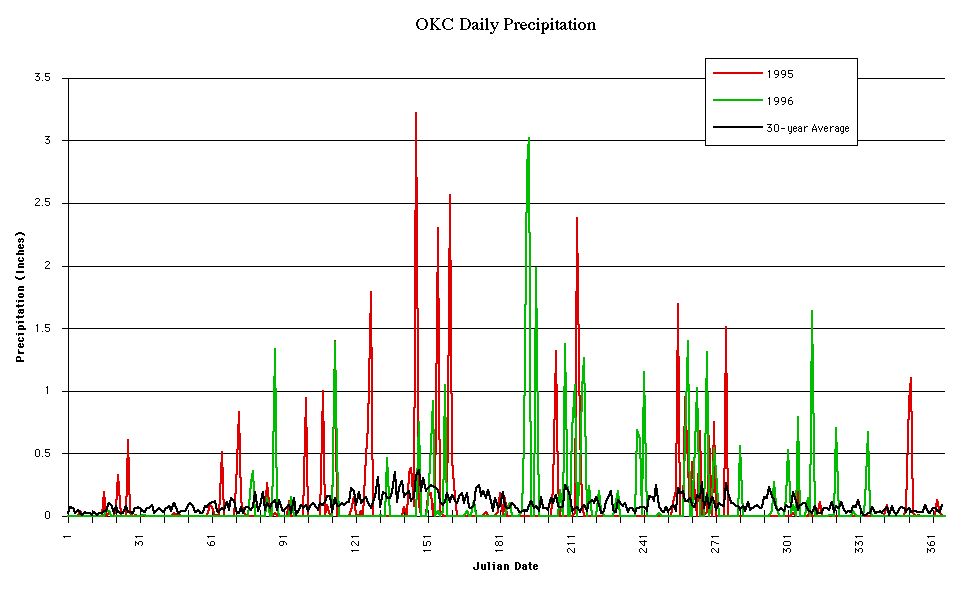
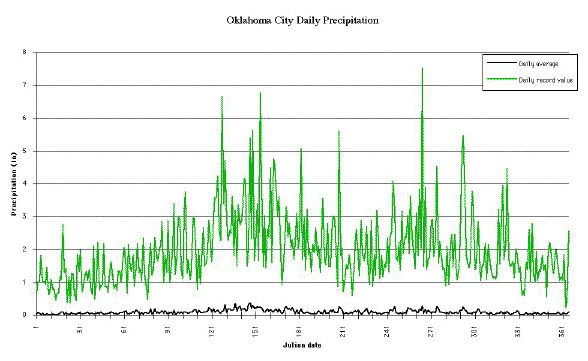
What is termed "normal" rainfall on any given day is typically taken to mean the average of all the observed rainfall events on a particular date. A lot of zero values get added in, and so the average rainfall is a small amount. A plot of daily rainfall observations in two different years compared to the "normal" values is shown here for Oklahoma City. Observe that the "normal" situation seems to be that it rains a small amount every day! In reality, of course, there are many days with no rain. On days when it does rain, the amount often exceeds what is "normal" for that day. The record values for each day of the year at Oklahoma City compared to the "normals" (like what I showed earlier for Bismarck) are shown here
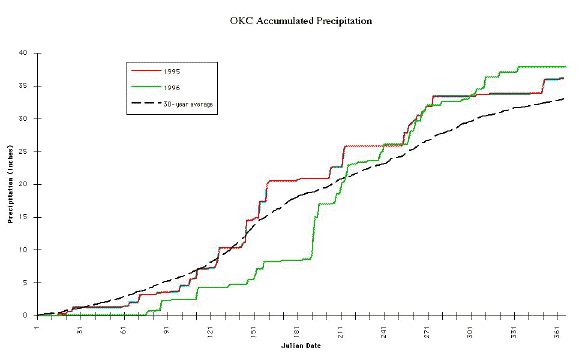
Of course, what the media typically report is not the average precipitation for a particular date, but the total accumulation for the year to that date . As shown here, the way precipitation accumulates in any given year doesn't look very much like what it looks like on the average. Notice in this plot that in neither year did the annual total match precisely what is "normal" (the 30-year average from 1961-1990), and recall the year-to-year variation in precipitation. Imagine all the different types of graphs of daily accumulated precipitation that could be made from all those different years of data. Precipitation is particularly difficult to characterize by the word "normal" in any really meaningful way!
Note that the frequency of observed occurrence is found from these data by dividing the observed number of occurrences by the period of record. If an event exceeding some threshold magnitude occurred 10 times in 100 years, that is an average frequency of once every ten years ... it almost certainly will not have been 10 evenly-distributed events, though. When the distribution of events of that magnitude as a function of time is considered, one thing will be very obvious: they do not occur at regular intervals of ten years! In fact, for rainfall measurements, there is a distinct tendency for events of a particular size to occur in clusters, with long periods in between where nothing of that size occurs.
The frequency values for low-frequency events that have been estimated by extrapolating the distribution beyond the actual observations are all less than one event per the period of the actual record. That is, in the period of record (say 100 years), such an event was never actually observed! Given a record length of Y years, the lowest frequency that can be seen is Y -1. For Y = 100 years this gives a lowest frequency of one per 100 years. By extending the graph, estimated values for the frequency that are less than one can be obtained, as already noted. If the hypothetical frequency is 0.1 per 100 years, this is the same as once per 1000 years, or a so-called "thousand-year" event. A "500-year"event would be 0.2 per 100 years, and so on. It's pretty difficult to observe 0.1 events! Given that in the United States, a 200 year continuous record is pretty unusual, it is clear that 500- or 1000-year recurrence intervals are the result of such extrapolations.
The chances of an event of some given magnitude increase with time, but the passage of one recurrence interval does not guarantee that you will have seen one, and only one, such event. The longer the period of record, the more likely an event of that magnitude will occur. If the event's magnitude is small (say a "10 year" event), it will occur relatively often and if each 100 year period was considered separately, the frequency of such an event would look pretty much the same over each 100 year interval (10 events per 100 years). For very large events (say a "500 year" event), the frequency within any 100 year interval would fluctuate considerably. In some centuries, no such event would occur. In other centuries, there might be several such events. But if we somehow could look at 10,000 year intervals (perhaps using the techniques of paleoclimatology), the frequency of some event with an average recurrence interval of 500 years would be about the same (20 events in every such 10,000 year period). At this point in human history, these are pretty abstract concepts, obviously!
As a bit of a digression, suppose the frequency of "10 year" events is observed somehow to be changing from one century to the next. Any such change might be viewed as a change of the climate, although that might be an arguable conclusion. On the other hand, it would be very hard to infer much about changes in the frequency of "500 year" events in terms of climate change, because over the time from one century to the next, it is quite possible that all that has been observed is a natural fluctuation in the frequency of "500 year" events. The ground here is getting pretty shaky.
Part of the problem is to decide what is really meant by the word "climate"? The word climate generally is taken to mean some sort of average of the weather. That much is fine, but what is the averaging period? And how much data are there to be certain (in a hard, statistical sense) that the average is changing? As already noted, solid meteorological observations are about two centuries old in most of the U.S., and some important observations (notably, those above the surface) have shorter periods of record than that. Of course, evidence can be found for what the climate might have been like a long time ago (ice ages, etc.), so the climate of the distant past was almost certainly very different from the climate of today, but it is really difficult to be certain of the details of the changing climate. And if the climate is changing all the time (as is probably the case), then whatever is called the "climate" is basically only a particular (and basically arbitrary) way of manipulating the data statistically. When the data are viewed with other choices having been made, perhaps the climate will appear more stable than it does when the choices are made another way. There are lots of good folks (as well as ignorant folks in the media and elsewhere) talking about how we humans might (or might not) be "changing the climate" ... and I have no information that says we are (or are not) changing the climate from what it would have been without human activities. However, if climate is changing all the time, how can the changes introduced by humans be distinguished from the changes that would have occurred without humans? It is very difficult to make this distinction. Even experts disagree about such things.[7] How can we have confidence that the media reports have done their job in educating us to be aware of the true situation? My belief is that we cannot rely on the media to keep us informed about such things!
Climate (Climatic status) is the thermodynamic/hydrodynamic status of the global boundary conditions that determine the current array of weather patterns.
His idea is that the global boundary conditions determine the sorts of permissible weather patterns. Hence, if the boundary conditions are changing, so is the climate. He notes that this status changes with time and the season, and that the climate includes the weather patterns associated with that status. As interesting as this idea is, it's not clear to me that it really has changed anything. We do not know the precise "boundary conditions" ... the use of this term is associated with treating the problem as a boundary value problem, a mathematical term ... and so we would still have to do some sort of averaging in order to treat the problem in any practical terms. It has not been demonstrated, moreover, that the problem is a pure "boundary value" problem ... it might be that with a given set of boundary conditions, the set of permissible weather patterns could also depend on the initial conditions (an "initial value" problem, in mathematical terms). However, I like the notion that the climate necessarily includes the fluctuations associated with the weather patterns permitted by a particular set of "boundary conditions." Reid's essay is certainly an interesting proposal that at least makes an effort to avoid the logical conundrums of climate as the average of the weather. I'm inclined to be supportive of its direction, if not the practicality and appropriateness of all its abstractions.
One particularly severe winter, or one notably long drought, or some spectacular series of devastating storms does not signal that the climate has changed. Not even all of those taken together are sufficient to foretell the Apocalypse. Nor should it be considered automatically as something unusual or particularly "abnormal," as I have been trying to show.
As I look at the data showing the variation of rainfall in Oklahoma City over a period of 91 years, I have a lot of trouble being confident in saying that climate change is or is not occurring. Yes, there recently does appear to be more precipitation than in the past. However, if I dug back into the record another 91 years, I might find find a period that looked very much like, say, the last 10 years. Given all the year-to-year variability, a true climate change (however we might want to define such a thing!) is pretty hard to detect. Even using sophisticated statistical techniques, it is hard to be completely sure! There are a lot of things that can affect the record, including the exposure of the raingauge, how the readings are taken, the design of the raingauge, the character of the surrounding region, ... many of these things have changed over the years, even at a single site. Assessing climate change is pretty doggoned difficult. Weather (and its average, the climate) changes on many time and space scales, and we can be certain that during the 200 years (or less!) of observations here in the U.S., we have sampled only a tiny fraction of those time and space variations in the weather (and climate).
So where does this leave us? Well, there are several conclusions that I want to you to consider:
The use of statistics to develop quantitative knowledge of atmospheric behavior is not some sort of black art, but popular presentations of that knowledge frequently are misleading because they ignore the statistics. Statistics is an important tool for development of an understanding of what is "normal" and what the "climate" is, simply because with a knowledge of statistics, the limitations of our understanding can be known . Typically, in the media, all of the warnings about the limitations of the procedures (often called caveats, a Latin word meaning beware ) are ignored. Many of these limitations are technical and difficult for the public to grasp, so the media usually do not present the caveats. Oversimplification is an understandable, if lamentable, tendency of media presentations. I would hope that most people would seek more information about such things, but folks willing to seek more information are rather exceptional, I fear.
Most people do not want to be bothered with technical issues because they feel they are irrelevant to their lives. Unfortunately, ignorance of this sort can lead the majority of the public to adopt inappropriate positions regarding decisions about our environment; an important example of an inappropriate position is one of apathy ("If there is so much disagreement about what to, then who cares?"). I believe it to be in every person's self-interest to know more about the environmental issues that confront us. The environment can be very unforgiving when we make mistakes, and makes no distinction when those mistakes are attributable to ignorance. Like the law, the atmosphere does not recognize ignorance as an excuse.
Acknowledgments. I have been assisted in this process by Dr. David Schultz, Mr. Dave Andra, Dr. Jeff Trapp, Dr. Harold Brooks, and Ms. Beverly Reese. These kind folks have helped me get the data used in the examples I have shown and/or engaged in helpful discussions about this topic.