Posted: 24 August 2010 Updated: whenever
These comments appear here because the International Journal of Health Geographics has no meaningful mechanism for allowing readers to submit comments on its articles.
Anyone wishing to respond to our comments should send their responses to cdoswell_XX_earthlink.net - either use the email link directly or cut and paste the address after substituting "@" for "_XX_". Your response and our comments on it may appear on this web page. If you wish your response to be anonymous, please explain why.
Being somewhat familiar with hazards related to convection, we found the results of the Borden and Cutter (2008 – hereafter, BC08) study to be puzzling. In our experience, the warm season threat to life from warm season severe thunderstorms is relatively modest, whereas the values presented in BC08 seemed literally incredible. The apparent discrepancy turns out to be attributable to the SHELDUS data base and how deaths are categorized therein. In particular, we observe dramatic examples of what we would consider to be inconsistent classification decisions, exemplified by these two choices:
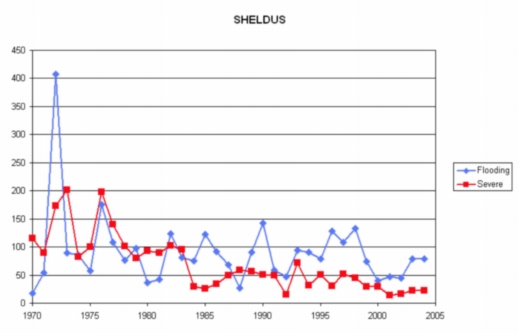
Flash flooding events from deep convective storms are not officially considered "Severe Storm" events by the National Weather Service. However we might view that decision, it nevertheless represents the established way to classify events. In any case, the preceding example shows the SHELDUS data base is inconsistent in applying classification criteria. There are some indications of considerable inhomogeneity in the SHELDUS data (Fig. 1).
For example, something unknown happened in 1984 to produce a major downturn in the number of "Severe Storms" fatalities. We are unaware of any possible explanation for this. The 1972 Rapid City, SD flash flood event evidently created the spike in the "Flooding" category for that year, but subsequent flash flood events, such as the 1976 Big Thompson Canyon, CO and 1979 Johnstown, PA flash floods weren’t included in that category, for reasons unknown.
Further, the way fatalities are attributed to counties, the fatalities in both the Rapid City, SD and Johnstown, PA flash flood events are diffused outward erroneously into surrounding counties. Many winter weather phenomena show up in a search of the category "Severe Storms/Thunderstorms". This data base is, in our opinion, significantly compromised in many ways. It would take a thorough study of the SHELDUS data base to understand in detail all the discrepancies, but it's evident to us that it can't be used to determine the relative importance of the various hazards in the way presented in BC08.
Although BC08 has drawn considerable attention in the popular science media, the use of the SHELDUS data base seems to raise important concerns for the validity of the conclusions in BC08. Anyone familiar with the existing data bases regarding natural hazards from weather (see references below) must realize that all such data bases have serious issues regarding sample size (see Doswell 2007) relative to the spatial and temporary variability in the data, especially in the realm of convective storm hazards. Most of such data are characterized by the dominance of rare, isolated events. When this is compounded by the presence of inconsistencies in classification and evident misclassification of the fatalities, it's hard to put much credence in the BC08 results.
There are other concerns for the BC08 assignment of fatalities to hazard classes. What is a "drought" fatality? Drought and heat are very different hazards and it's not clear just what about drought would cause fatalities. How about traffic fatalities from winter storms? These might properly be considered “indirect” fatalities – there is no evidence in BC08 that any consideration was given to the difference between direct and indirect fatalities from weather hazards. Moreover, we don't agree that all natural hazards should be lumped together into a single picture of generic hazards. The causative individual phenomena differ considerably in terms of vulnerability. Volcanoes present a relatively spatially-localized vulnerability – the hazard from tornadoes, on the other hand is difficult to localize. Tsunamis are inevitably associated with seacoasts, whereas the winter weather threat encompasses most of the contiguous United States. It’s not evident that putting all the hazards together in a spatial map offers any clear benefit over considering the spatial distribution of the individual hazards.
We agree with the notion expressed in BC08 that:
It is important to view natural hazard variability through a geographic lens so as to better inform the public living in such hazard prone areas, but more importantly to inform local emergency practitioners who must plan for and respond to disasters in their community.
Unfortunately, the BC08 study has some fundamental flaws that make it unsuitable for this expressed purpose.
Ashley, W. S., 2007: Spatial and temporal analysis of tornado fatalities in the United States: 1880-2005. Wea. Forecasting, 22, 1214-1228.
_____, and A. W. Black, 2008: Fatalities associated with nonconvective high-wind events in the United States. J. Appl. Meteor. and Climatology, 47, 717-725.
Ashley, S. T., and W. S. Ashley, 2008: Flood fatalities in the United States. J. of Appl. Meteor. and Climatology, 47, 805-818.
Borden, K. A. and S. L. Cutter, 2008: Spatial patterns of natural hazards mortality in the United States. Int. J. Health Geographics, 7:64, doi:10.1186/1476-072X-7-64
Brooks, H. E., C. A. Doswell III and M. Kay, 2003: Climatological estimates of local daily tornado probability for the United States. Wea. Forecasting, 18, 626-640.
Doswell, C. A. III, 2007: Small sample size issues illustrated using tornado occurrence data. Electronic J. Severe Storms Meteor., 2(4), 1-12.
______, H. E. Brooks, and M. Kay, 2005: Climatological distributions of daily local nontornadic severe thunderstorm probability in the United States. Wea Forecasting, 20, 577–595.