All the standard disclaimers apply. These are my personal opinions only and do not have any official status. Feel free to e-mail any comments to <cdoswell # earthlink.net> - use the email hyperlink or cut out " # " and paste in "@".
A question that has come up repeatedly over the years goes something like this: "We have been hit in [location X] by three tornadoes in 5 years! Are we in some sort of miniature version of 'Tornado Alley'?" Even a casual look at maps showing the distribution of tornado tracks reveals places where clusters of tornado occurrences can be found, as well as voids where no tornadoes have been reported. It's a known fact that on some days, usually involving tornado outbreaks, more than one tornado goes down a path that follows closely the path of another tornado earlier in the day. In many parts of the US, there are stories (often, but not always, attributed to native Americans) that tornadoes won't ever cross some barrier (a hill, a river, or whatever), or won't go down a particular paths for some vaguely-specified reason. Similarly, other stories exist to the effect that tornadoes have a preference for following some feature (sometimes the very same features are identified in that role that are considered barriers elsewhere!). Are some places destined to experience many tornadoes and other places virtually none? Do miniature 'Tornado Alleys' actually exist?
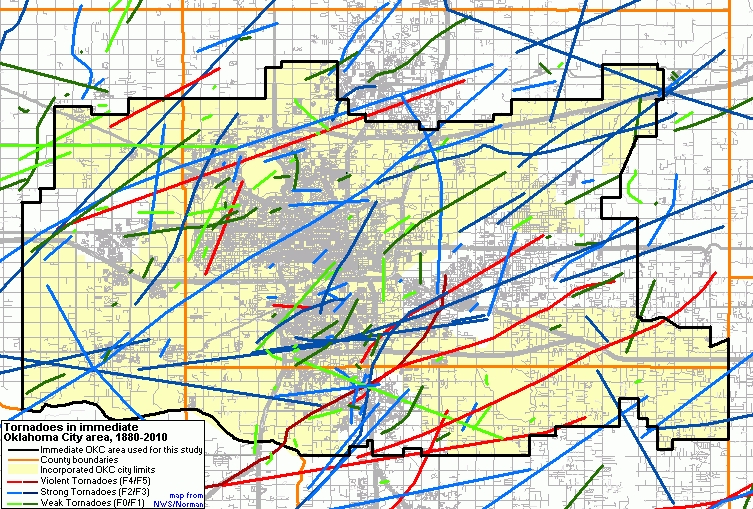
In my opinion, it's not at all foolish to ask such questions. There are reasons to suspect that there might indeed be some local topographic features that promote the development of tornadoes in one place and other topographic features that inhibit tornadoes in another region. If we examine a map of Oklahoma City, OK tornadoes (Fig. 1), there seem to be locations where tornado paths overlap -- there are some locations in the suburb of Moore, OK that were hit on 4 October 1998, 3 May 1999, and 8 May 2003! Just looking at this map reveals several clusters and apparent voids over this relatively long historical record (131 years) of Oklahoma City tornadoes. It also is clear from this figure that most tornadoes are weak and have relatively short paths, but the strong and violent tornadoes tend to have longer tracks and so can affect much more area.
Figure 1. Map of Oklahoma City area tornadoes, 1880-2010. See the figure legend for details.
[National Weather Service image - http://www.srh.noaa.gov/oun/?n=tornadodata-okc]
Of course, there are large-scale variations in tornado frequency, as illustrated by the maps that can be found at the National Severe Storms Laboratory's Hazards Page. These maps show a heavily-smoothed version of the distribution of tornado touchdown points (not the tracks!), where the smoothing has been done specifically to highlight the large-scale variability and eliminate the small-scale detail. Thus, for example, it's unsurprising to see the threat of violent tornadoes (Fig. 2) centered in Oklahoma, whereas the chances for violent tornadoes in, say, New England, are quite small by comparison. No matter how one might choose to define Tornado Alley (it's not a scientific term), it's clear that Oklahoma is in it, while New England isn't in it. Recent events (April 2011) have reinforced the reality of the so-called Dixie Tornado Alley across Mississippi and Alabama.
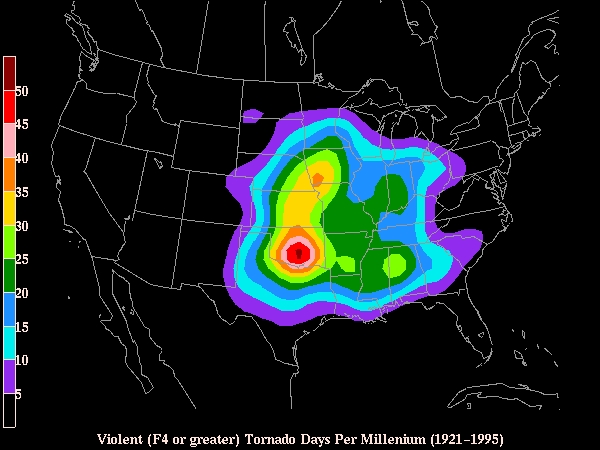
Figure 2. Map of the frequency of violent tornado touchdowns within 25 mi of any given point. [National Severe Storms Laboratory image]
The probability of experiencing a violent tornado in New England may be much less than in central Oklahoma, but it's not zero! On 9 June 1953, violent tornadoes hit New England and Worcester, Massachusetts in particular. I've written elsewhere about violent tornado probabilities, but I want to expand a bit on that discussion. Probabilities can be somewhat tricky and a key to understanding them is to pin down precisely what event is being considered, over what area, and over what time span. If we consider the chances for experiencing the violent winds within a violent tornado in a particular square mile, during a particular year in central Oklahoma are about 1 in 10 million. Nevertheless, some parts of Oklahoma have experienced violent tornadoes on separate occasions separated by only a few years! How can this be?
To understand it, let's consider the odds of experiencing violent winds in a violent tornado in one or more unspecified locations in the tornado-prone area of the US (about 1 million square miles) within a 50-year time span. It's virtually 100% certain that one or more violent tornadoes will affect the US in a 50-year period! So the probability depends on what event is being considered and how large the space-time volume is that's contained in the probability statement. The more specific about the event and its location in space-time you want to be, the lower the probabilities. And the range of probabilities can be enormous, depending on those choices.
Now, to explain the outcome of a the violent winds of a violent tornado hitting a particular square mile of area more than once in a short time span, let's assume that the probability in any given year is independent of the year. That is, what happened in previous years has no impact on the probabilities for the year in question. This is probably a pretty good assumption, actually, but it's not absolutely true, of course. It's just a reasonable simplification. So if the odds of that event (experiencing violent winds in a violent tornado) are 1 in 10 million for that particular location (in central Oklahoma) in any given year, then over a 5-year period the probability is very nearly exactly 5 times greater - about 5 chances in 10 million. Clearly, that doesn't affect the odds by much. However, if instead of specifying which square mile (in central Oklahoma), we ask the question slightly differently: what are the chances of one or more square miles being affected by the violent winds of a violent tornado within the tornado-prone area of the United States over a 5-year span. That requires an adjustment in the local probabilities, to the average value over the tornado-prone area. Let's say the average over that whole area is 1/10 the value in central Oklahoma, just for the sake of the argument. That turns out to be roughly 5 million chances in 100 million -- a 1/20 chance. But if a particular spot is hit by the event, what's the probability it will be hit again within that 5-year span? Now we're back to the odds for a particular square mile. Hence, the odds of a particular spot being hit twice in 5 years is roughly 5 in 200 million. But again, if we don't know in advance which square mile will be hit twice in 5 years, we multiply it by one million once again, so it's about 1 in 40 that someplace in the tornado-prone region will be hit twice in 5 years! In 50 years, that probability could be relatively high. I suspect if we worked this out in detail using the track information (not just the touchdown points) from observed tornadoes over the past 60 years, the actual probabilities derived from the observed frequencies would be somewhat higher than these back-of-the-envelope (rough) calculations.
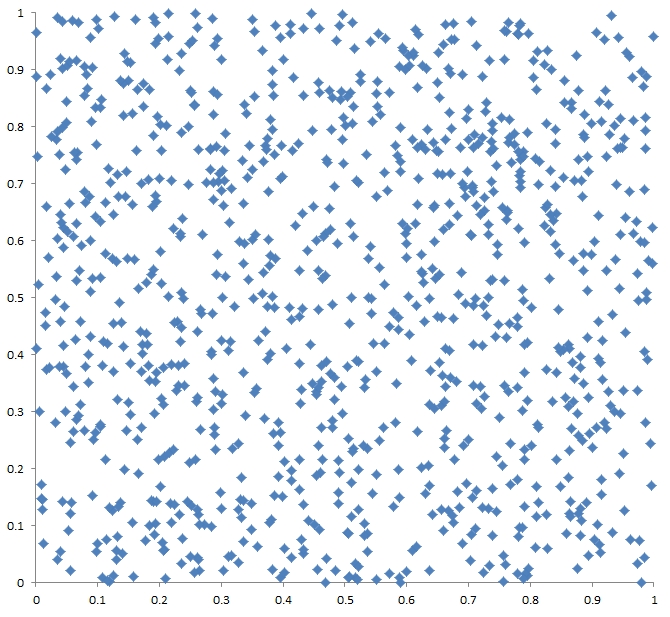
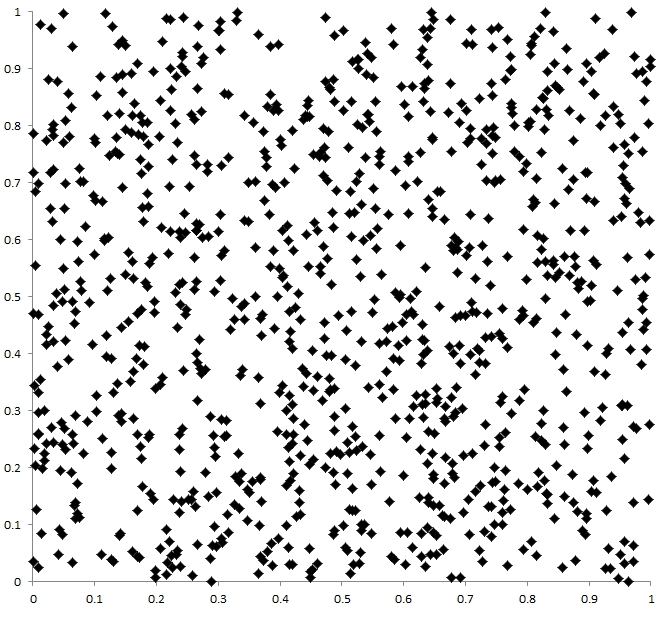
Now we're ready to consider the details of the spatial distribution of tornadoes. We've already seen the presence of clusters and voids that seems to beg the question -- Is there some reason for that cluster to be there, and a void to be in some other location? Unfortunately, this question evidently springs from a fundamental misunderstanding among lay persons about what random actually means. A truly random distribution is not some sort of uniform distribution! Rather, it is characterized by clusters and voids! To show this, I created a map of 1000 points whose x- and y-coordinates were produced by the random number generator in my spreadsheet program. As can be seen in Fig. 3, there are numerous clusters and voids over the domain of the points. For all intents and purposes, then, the distribution of tornadoes is fundamentally and scientifically indistinguishable from a purely random distribution! If your particular square mile is hit by multiple tornadoes over some short time span, it doesn't mean that you're in the metaphorical crosshairs of a miniature Tornado Alley!! You're just unlucky. I wish I could offer something that might be more comforting, but that's about all the meteorology can provide.
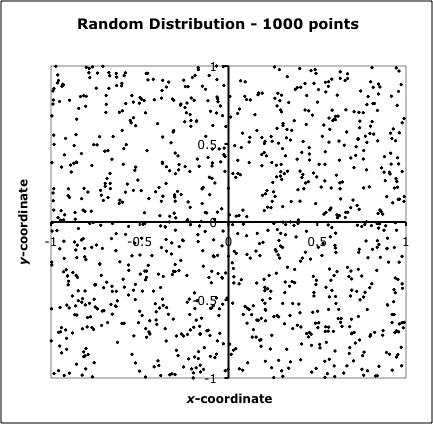
Figure 3. Map showing a random distribution of 1000 points (black dots) in x-y space.
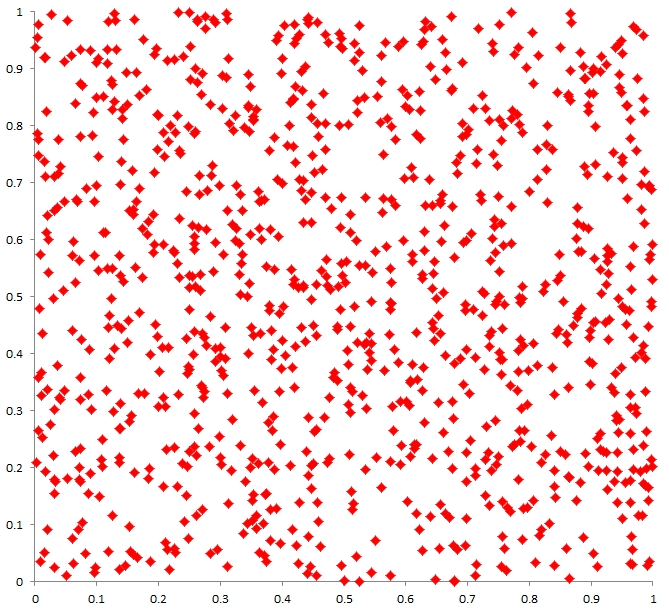
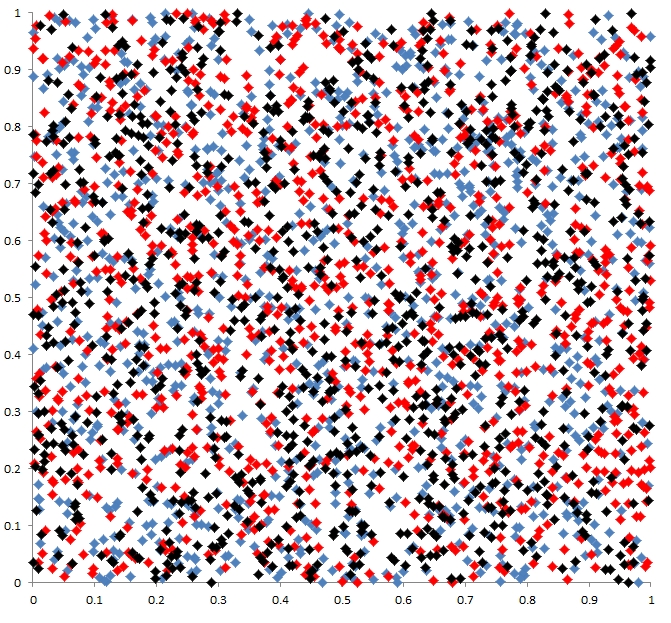
Given the overall regional probabilities of the sort illustrated by Fig. 2, you're likely to have more or fewer tornado events in a given time span at your particular location, but the distribution of those tornadoes within your local area doesn't necessarily indicate some sort of preferred locations. Now if you could wait long enough, wouldn't all those clusters and voids eventually 'fill in'? Well, the answer is that you might have to wait a looooooooong time. To show this, I generated another 1000 points and plotted them over the results shown in Fig. 3. The results (Fig. 4) do reveal that some of the voids have been filled in, but some remain, as well as new clusters. Real random distributions don't become 'uniform' very rapidly. We only have reliable tornado records for about 60 years - before that, the occurrence of tornadoes is strongly under-sampled (see here and here).
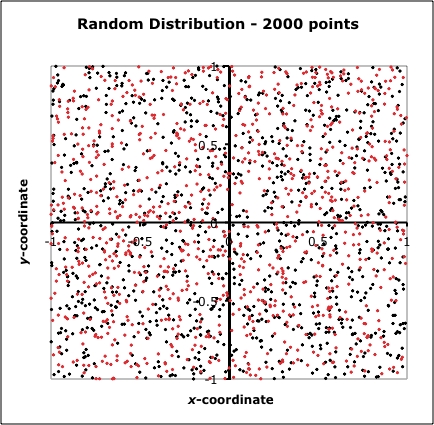
Figure 4. As in Fig. 3, except with an additional 1000 randomly distributed points (red dots).
My colleague, Dr. Harold Brooks, has made an interesting addition to this way of illustrating things. He says
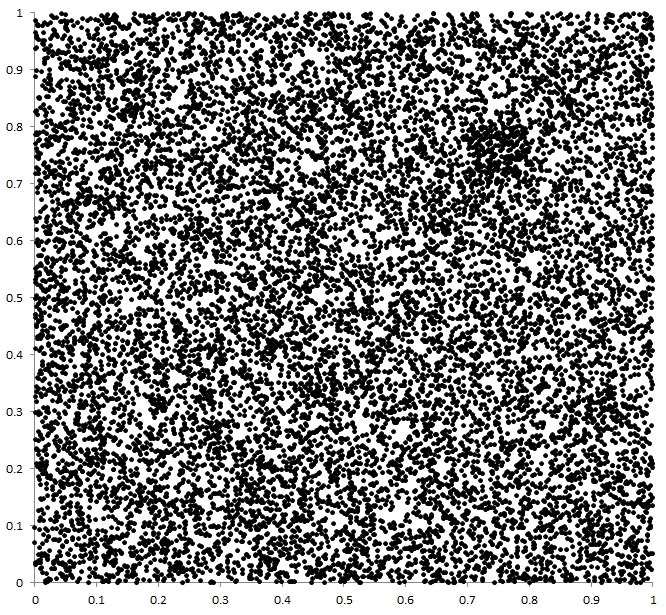
I produced 14000 locations with a uniform distribution except that in a square with dimensions 0.1x0.1, I made the probability of an event 2X the rest of the area. To do this, if an original location fell in the pre-determined square, I created another event (uniformly distributed) inside the small square, so that in the 14000 locations, there should be ~140 in each 0.1x0.1 box except for one box with ~280 (the box I picked ended up with 148 initially, so 296 total). The first three images show the first three sets of 1000 random locations with their extra points included. The 4th image is the sum of the first 3 and the final image is all 14148 points. The final one does have a smaller dot size so that the image isn't completely blue.
Figure 5. Distributions contributed by Dr. Harold Brooks, showing the 1st thousand (plus "extra" points, which applies to all these figures) at the top left; the 2nd thousand at the top right, the 3rd thousand at middle left, the aggregate of the first 3000+ points at middle right, and the 14,000+ points at the bottom.
Picking the center point I used to determine the doubled square is pretty hard, except perhaps in the last one. In the next to last one, binning everything into the 0.1x0.1 bins, the "lucky" box is 4 standard deviations from the mean number of points and it's still not 100% obvious visually.
It should be pretty evident from the figures supplied by Dr. Brooks that if you didn't already know the location of the "special" box with twice the frequency, it would be tough to pick it out from the other clusters and voids in the 3 1000+ member samples; it's not even very evident from the 3000 member sample. By 14,000 samples, it's beginning to become evident. And having twice the frequency of surrounding areas (4 times the standard deviation) is likely to be considerably beyond what we might expect from plausible physical mechanisms favoring one local area over its surroundings! It's only in a very large sample that even this relatively large frequency variation becomes visually evident in a quasirandom distribution.
Dr. Cody Kirkpatrick has emailed me, raising the issue of various sources of bias in the spatial distributions of observed tornadoes -- population density, roads, and so forth. These have been discussed in many publications regarding the tornado databases and won't be discussed further herein. It is certainly worthwhile to mention this issue here, however, as the various biases in the observed data further complicate the challenge of trying to show that the observed distributions are related to topographic features via some physical mechanism. He graciously has provided the following two figures that illustrate nicely the biases that are present in the data:
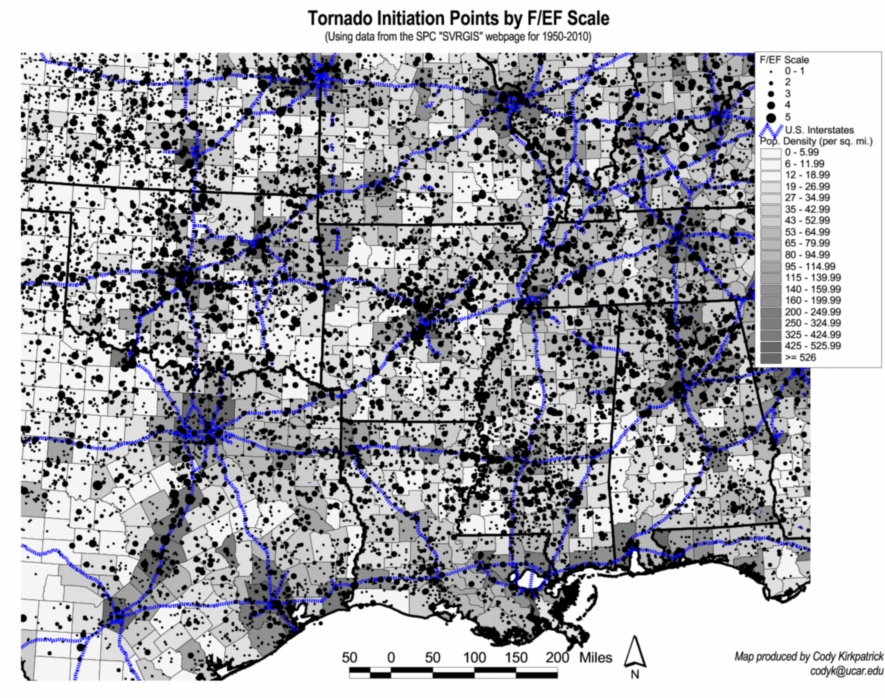
Figure 6a. Map of tornado touchdown points plotted on a background map that shows interstate highways and county population densities.
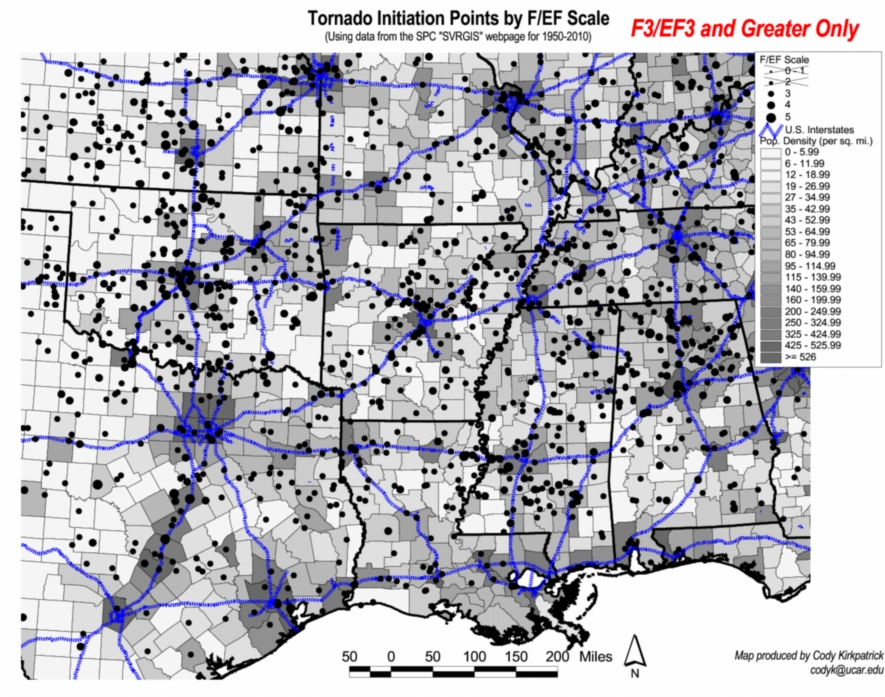
Figure 6b. As in Fig. 6a, except for F3+ tornadoes only.
In summary, then, if we had a thousand years of detailed information about tornado tracks, comparable to what we can obtain today, it's likely that the resulting frequency distributions would be somewhat more locally uniform (the random clusters and voids eventually would be smoothed out) than they are with the information we have now. Large-scale variations would persist, of course, and we have some scientific understanding of the reasons for those variations. They're related to the physical geography of the continental US, producing supercell storm-favorable environments relatively frequently over the Great Plains and northern Gulf states. Of course, over a thousand years, the climate might change enough to have an impact on those large-scale variations, as well. Perhaps we could say with more confidence then that any particular cluster or void had some plausible reasons rather than being just an artifact of random variations. I won't be around to see that happen, naturally.
What our existing data tell me is that our existing sample of these relatively rare events is way too small to isolate and confirm any particular local geographic maxima or minima as miniature Tornado Alleys. They might represent true local peaks and valleys or they might only be there because the tracks are randomly distributed. Distinguishing which explanation is true in any given example might be a bit tricky, but statistical methods are designed to do so if the data permit.
It's possible that some of the existing small-scale maxima and minima would remain in a very long-term, large sample and so could be seen as representing small-scale details of the true distribution. But with the information we have now, it's not possible to say with any confidence that existing clusters and voids in tornado occurrences are anything more than random statistical fluctuations. Therefore, although it's not unreasonable to ask such questions as I've paraphrased here, the science of meteorology can offer very little in the way of evidence to support the existence of miniature Tornado Alleys.