NOAA, Environmental Research Laboratories
Weather Research Program
Boulder, Colorado 80303
National Weather Service Forecast Office
Fort Worth, Texas
[But that submission never came. This
manuscript hss not been substantially changed from the version that
was completed in 1985. By preserving this in its 1985 form, a
"snapshot" of the perspective we had at that time is
available.]
Posted: 26 September 2004 Updated: 23 November 2005 - added completed Fig. 2. All images are copyright-protected. If you wish to use any image, or to comment on anything contained herein, contact me at cdoswell@earthlink.net
Visual observation of thunderstorms is reviewed briefly to assess the role of such observations in research and operations. Beginning in 1972 in Oklahoma, a program of intercepting severe thunderstorms has been underway which has contributed substantially to the meteorology of severe convective storms. This program's history is given a short review and the impact of the observations on research and operations is discussed. Examples of where storm intercept operations have made important contributions to both areas are presented.
A. Some historical perspectives
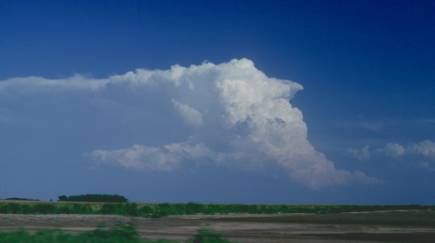
Visual observation of thunderstorms is certainly the oldest form of studying them. For a ground-based observer, the cumulonimbus cloud is about the largest meteorological phenomenon that can be seen more or less in its entirety (Fig. 1). Of course, a human observer cannot see into the cloud and can view only that side of the storm he or she faces. Since thunderstorms can produce hail, damaging winds, tornadoes, heavy rain and lightning, all of which can pose a substantial threat to life and property, both meteorologists and the general public share an interest in learning about these weather events.
This article is intended to document the contributions to meteorology (research and operational) by mobile, scientifically trained observers based in Oklahoma since 1972. By necessity, it is a personal perspective on the program and is not intended to be a comprehensive review of visual storm observation. The year 1972 marks the beginning of organized severe storm intercept efforts by the National Severe Storms Laboratory (NSSL) and the University of Oklahoma (OU). However, before dealing specifically with those programs, a brief historical review of visual storm observations is needed to provide a context for understanding the Southern Plains intercept program.
Most people are familiar with thunderstorms -- however, it is also true that thunderstorms in their severe forms are relatively rare events, even for those living in climatologically-favored areas (Schaefer et al., 1980). On those rare occasions when persons observe a severe thunderstorm event, the main concern may well be coping with the immediate hazards rather than scientific observation! Furthermore, most citizens' attention is drawn to the storm only when hazardous phenomena are underway (or imminent). Finally, the observer's meteorological knowledge level has an influence on how much of the experience is relevant, so that citizens normally retain only the most immediate aspects of the event (i.e., those which affect them directly).
Thus, although many people have been through at least one severe thunderstorm event, most people have sampled only a tiny fraction of the totality of the phenomenon through direct visual observation. This means that the majority of observers lack a context in which to place their observations; for example, if one sees a particular cloud structure at a given moment in a given storm's life, one may not know if that structure is unique to that storm, common to all storms, or characteristic for only part of the life cycle of a particular class of storms. While it is possible to see most of the storm from some locations, one must know something of such storms to be able to understand the observations.
Ludlam (1963) has provided an excellent summary of the scientific thought produced by historical visual storm observations. His summary includes cumulonimbus cloud models by various authors (see his Fig's 1 and 2), who based their models largely on direct visual experience. Their observations led them to speculate about the airflow and internal characteristics, but there was relatively little quantitative information to guide these speculations.
This situation persisted through World War II, during which it became apparent that the field of meteorology was woefully ignorant about thunderstorms. In order to remedy this situation, an ambitious program to study them was initiated after the war, the famous Thunderstorm Project. This provided our first quantitative understanding of thunderstorms and culminated in the publication of the project report by Byers and Braham (1949). During the project, data were collected in Ohio and Florida from aircraft probing, the then-new radars, dense networks of surface observing sites, and rawinsondes. These exciting new data had an enormous impact on convective storms meteorology and made the non-quantitative visual observations seem much less important. The data-gathering methods of the Thunderstorm Project became the model upon which virtually all subsequent thunderstorm-oriented field programs have been based.
In the early 1950s the National Severe Storms Project (which later evolved into the National Severe Storms Laboratory) continued this trend in which visual observations were given little attention. For example, Donaldson et al. (1965), commenting on their visual observations, explained that they were made by three groups of meteorologists, who for various reasons (not all planned) found themselves in positions from which they had an excellent view of [the severe thunderstorm] as it intensified...
In spite of this trend, some independent scientists made an effort to obtain visual observations, notably Ward (1961) and Bates (1963). The work of Ward and Bates emphasized the so-called "flanking line"1 as a structure from which tornadoes developed and had a profound influence on the Southern Plains intercept programs which began in 1972.
One way to quantify visual observations is to record them on film for later photogrammetric analysis. A few tornadic storms have been filmed by a large number of citizens and those data have been extensively analyzed by photogrammetry. Perhaps the best-known examples are studies by Hoecker (1960) and Fujita (1960). Hoecker's analysis of the Dallas, Texas tornado of 2 April 1957 provided some of the first quantitative estimates of windspeeds within the tornadic circulation. Fujita's report on the Fargo, North Dakota tornadic storm of 20 June 1957 was significant in that the abundant photography revealed many cloud structures on scales between the tornado and its parent cumulonimbus cloud. Golden (1974) was also applying photogrammetry to waterspouts prior to 1972 and in his case the filming was done by scientists intentionally intercepting the waterspouts.
In addition to these rather isolated efforts by scientists to use visual information for severe storm studies, a few individuals were making intentional storm intercepts. Because they have operated outside established scientific associations, it is impossible to know how many such people there have been over the years, what has motivated their efforts, or what they may have learned. A few have come to our attention.2 Based on these contacts, we find that they have operated essentially alone, without formal meteorological training, and with only their personal resources upon which to draw. Nevertheless, these "amateur scientists" have developed an experience base of nontrivial proportions vis-à-vis severe thunderstorms. It is this empirical knowledge that has allowed them to have considerable success in their efforts.
Although such individuals may document their experiences with severe thunderstorms on film, their information can have no impact on the formal science of meteorology unless they develop contacts with research and/or operational meteorologists. It is a fact that these people must deal with an image problem when trying to develop those contacts: intercepting severe thunderstorms intentionally may well be considered aberrant behavior, especially when the individual has no formal scientific credentials. The lack of meteorological training also makes communication difficult, owing to an absence of shared terminology.
Thus, before 1972, and in the wake of the Thunderstorm Project, the scientific community had by and large come to consider visual observations to be of relatively little value in comparison to quantitative, traditional meteorological data. Of course, some exceptions to this rule existed, but visual input generally was inconsequential to research and operations involving severe convection.
B. The NSSL - OU intercept program
Circumstances developed in Oklahoma in 1972 which changed the role of visual observations in meteorology. Perhaps of paramount significance was that at NSSL Joseph H. Golden was given the go-ahead to extend his waterspout studies to tornadoes, in collaboration with Bruce P. Morgan (then affiliated with Notre Dame University). Their objective was to obtain high-quality, up-close movie films of tornadic debris clouds to be used in photogrammetric analysis, in the tradition of Hoecker and Fujita. At the same time, a group of OU meteorology students, all sharing an interest in visual storm observations, became involved with the NSSL intercept project. They also commenced independent storm chases, in part under the guidance and with the support of Prof. Yoshi K. Sasaki (OU).
Although the program was initiated to study tornadic circulations, the feasibility of intercepting severe thunderstorms using ground vehicles had yet to be demonstrated. Little or no knowledge was available to guide those first intercept attempts - or even to suggest that the idea was worth pursuing. Ward's successes were rather limited in terms of the number of storms he had attempted to intercept. When he died in 1972, whatever knowledge he had about intercept strategy was lost to the storm chasers.
As mentioned above, there was a widely-held belief that this was not appropriate behavior for professionals and this was accompanied typically by skepticism about the likelihood of success. Perhaps to the surprise of many (including some of the participants), that first year's efforts yielded some successful intercepts. Although 1972 was not a year with numerous severe thunderstorms or tornadoes in Oklahoma,3 several interesting storms, including ones that produced tornadoes, were intercepted and filmed (see Golden and Morgan, 1972). More important than the actual photographic data was the experience gained intercepting storms.
After just one storm season, new forecasting and intercept strategies had been developed, since it became clear that a successful intercept depended heavily on a successful forecast. An unanticipated feedback process was established in which careful subsynoptic scale diagnosis and prognosis preceded in-situ observations of the convection which developed (or failed to develop!). The visual inputs from several chase teams on a particular storm day would be compared initially during informal post-storm debriefings, augmented by photography when the films were developed and returned, supplemented by traditional meteorological data collected during the NSSL spring field program, and updated with new inputs from the next storm day. This interest in blending visual information with more traditional, quantitative data was the result of the formal meteorological training shared by most of the participants, and characterized the intercept program from the beginning.
It became obvious to all that while severe thunderstorm intercepts were feasible, it was more difficult to get in close enough to obtain the sought-for debris cloud films. Thus, the original rather narrowly-defined objective began to evolve into a rather broad range of observational goals, such as documentation of the overall storm structure, lightning occurrence, hailstone collection, subsynoptic scale forecasting techniques, etc. Also, the number of participants increased as some of those at first hesitant participants were quickly converted to enthusiastic team members.4
Experience gained in 1972 proved to be quite important in what turned out to be the watershed year: 1973. This year produced the greatest annual total of reported tornadoes nationally since records have been kept (as of this writing) - more that 1,100 tornadoes. Oklahoma shared in this abundance (see footnote #3), with intercepts beginning early in March and continuing at frequent intervals throughout the spring. At the same time, NSSL was experimenting with Doppler radar for storm detection and observation of internal storm circulation during their field program.
This parallel growth in new techniques paid off on 24 May 1973, when the small town of Union City, Oklahoma (see Fig. 2) was struck by a violent tornado. Unlike most other devastating tornadoes, the personal tragedy on this occasion took on a special significance through the scientific gain. The storm developed in full view of three intercept teams5 - one from NSSL and two from OU - as well as being in near-optimum range from the NSSL Norman Doppler radar. Since the storm occurred during the NSSL spring field program, abundant supporting data were available and by virtue of the storm's slow movement and high visibility, considerable photography by eyewitnesses became available. The first publication discussing the event was a collaboration by the two OU chase teams (Moller et al., 1974), followed by a host of others (e.g., Golden and Purcell, 1978b; Davies-Jones et al., 1978; and Lemon et al., 1978, to name only a few). Visual information played an important role in the total scientific analysis of this storm. Thus, the little town of Union City, Oklahoma joined Dallas and Fargo on the list of sites of scientifically important tornadic storms. Other successful intercepts during 1973 assured the program of continued vitality, and enhanced the process of strategy development, honed forecasting skills, added new insights, etc.
In the years since 1973, the program has continued to evolve, building a substantial knowledge base in the process. Lee et al. (1981) and Davies-Jones (1982a) have documented many aspects of the NSSL Tornado Intercept Project (TIP), including some of its history and accomplishments. Bluestein (1980) has given a description of the OU intercept program as of 1979. Original team members have moved on, to be replaced by new participants. New intercept tools like mobile radio communications have been developed. Over the years, many severe thunderstorms have been intercepted and observed through a substantial part of their life cycle. Numerous tornadoes have been documented, including some for which the long sought-after debris cloud films have been obtained.
The scientific contributions are the subject of the remainder of this paper, but it should be noted before we turn our attention to those contributions that the Oklahoma program's successes certainly have encouraged new programs to spring up elsewhere. Although other programs including visual documentation have existed elsewhere independently,6 it may be fair to say the Southern Plains intercept projects have added new professional esteem for the value of all such efforts. Several universities have supported intercept programs of varying sorts, including (but not limited to) Iowa State, Wyoming, Texas A&M, Colorado State, Mississippi, and Texas Tech. During its existence, the National Hail Research Experiment (NHRE) had intercept teams in the field (with an emphasis on hailstone collection). Summer field programs for the Prototype Regional Observing and Forecasting Services (PROFS) have included intercept teams, as have the Joint Airport Weather System's (JAWS) projects. More examples exist, but this should suffice to show that mobile field teams have been accepted as a valuable adjunct to traditional meteorological data-gathering techniques. Lest someone be offended by our having failed to mention their program of field intercepts, we hasten to say that any such an omission does not imply that we think little of their efforts. It is not our goal to provide an exhaustive review of every program that ever included a field team. Participants in other intercept programs are encouraged to write down their perspectives on the value of their intercept observations, and we intend no offense to anyone in this personal account.
A. Subsynoptic scale structure and evolution
As mentioned above, an understanding of subsynoptic scale processes is essential to the type of forecasting upon which field intercepts depend. After the morning sounding data and numerical model prediction packages come in, decisions have to be made about if, where, and when severe convection is likely to develop. When using ground vehicles, it may be difficult (if not impossible) to make position adjustments fast enough if the team is too far away from the target storm when it develops. Ideally, one should already be in the field (say, within 100 km of the storm) well before severe phenomena commence. Thus, teams attempt to depart between 1000 and 1200 (local time) in order to reach the area forecast to be most promising by the time the storms are expected to begin. Since the Convective Outlook issued by the National Severe Storms Forecast Center (see e.g., Weiss, 1977) is too general for these purposes, considerable effort is required to make the proper forecast decisions.
Early in the intercept program, it became clear that severe weather often did not occur in the "classic" weather patterns (see Maddox and Doswell, 1982a). In fact, some of the most successful chase days have been associated with relatively innocuous or atypical synoptic situations. In assessing the impact of this on intercept operations, it may be said that chase crews feel it is better to chase on days when nothing happens than it is not to chase when something actually occurs. Using the terminology of verification, false alarms are more easily tolerated than failures to detect. However, there are limits to this. Some intercept teams have fewer resources than others and so must be proportionately more careful to avoid false alarms.
By the end of the 1973 season, certain subsynoptic weather patterns had been identified by Tegtmeier (1974) as significant. Tegtmeier called them the Subsynoptic Scale Low [pressure] system, or SSL, and the Dry Line Bulge, or DLB. A schematic with both of these features is shown in Fig. 3. Although Tegtmeier's work was independent, it is clearly related to the findings of Whiting and Bailey (1957), who pointed out that tornadoes tend to occur in two areas: south of the track of the low pressure center, and also to the east and northeast of the low. Doswell (1977a,b) has shown cases in which these areas represent pre-existing localized peaks in subsynoptic scale moisture convergence. They may also be characterized by warm thermal advection (see Darkow et al., 1958) in the lower troposphere, which has been shown by many (e.g., Means, 1944; Maddox and Doswell, 1982b) to be favorable for intense convection.
Forecasting convection remains a challenge, as anyone who has ever tried to do it quickly finds out. This is as much a matter of a lack of basic physical understanding as it is an operational problem. For example, one of the most difficult things to face in forecasting for intercept operations is to decide what form the day's convection will take. Although the science of meteorology has not yet resolved this question (see National STORM Program, 1984), storm chasers have found some degree of success by paying very careful attention to the details in the soundings, and particularly the vertical profile of the wind. This reinforces the results of Weisman and Klemp (1984), whose numerical model calculations are, in turn, suggestive of approaches to intercept operations forecasting (e.g., watching for backing of the surface winds as an indicator of increased tornado potential, as discussed in Sasaki and Tegtmeier, 1974).
A by-product of intercept operations in any region is an improved understanding of the climatology of severe weather events in the region. For example, although the available severe weather occurrence data (e.g., Kelly et al., 1978) only hint at it, storm intercept teams believe that west Texas may well be the most severe weather-prone region in the world, particularly in the vicinity of the Caprock escarpment (as noted in Fankhauser, 1971 and discussed in Doswell, 1982).
Further, although there is, again, no quantitative study to support it, there is speculation that climatological "corridors" exist in which severe weather incidence is noticeably higher than in surrounding regions. Of course, this may be an artifact of looking at too short a period of record, but even a "transient" phenomenon of this sort (i.e., over a period of order 10 years) would be significant. To be somewhat more specific, during the years of chase operations, an Oklahoma track defined roughly 20 km either side of a Cordell - Binger - Union City - Edmond line (see Fig. 2) apparently has seen a disproportionately large number of severe storms relative to areas north and south of that line. Another such corridor may run along the line Walters - Duncan - Pauls Valley. The lack of scientific proof is a reflection of a lack of proper data by which to conduct the appropriate statistical calculations. If one could verify that such corridors exist (in Oklahoma or elsewhere), it would be an interesting challenge to provide a scientific explanation.
B. Storm structure and evolution
It is in the area of describing storm structure and evolution that storm intercept has been most influential on research. As noted above, the opportunity to observe a substantial number of storms over a significant fraction of their life cycles is unprecedented. Such a set of observations has allowed the participants to develop the context we referred to above, by means of which a given observation can be understood in terms of the whole class of convective storms. Thus, intercept personnel have a rather well-supported knowledge of what are common features in convective storms (severe or otherwise). Scientific notions based on theoretical models and/or individual case studies have been discarded or supported by intercept crews. Examples include: the electrical origins of tornadoes (Vonnegut, 1960; Davies-Jones and Golden, 1975), the existence and role of the rear-flank downdraft (Nelson, 1977; Lemon and Doswell, 1979), tornado dynamics (Eskridge and Das, 1976; Davies-Jones, 1982b,c), and flanking lines (Ward, 1961; Bates, 1963; Lemon, 1976; Davies-Jones, 1982a)
Storm chasers also have documented the life cycle of the tornado itself (Golden and Purcell, 1978a). While the Golden-Purcell description refers to a single event, it is supported by the majority of observed tornadoes. Of course, the crews have seen exceptions to this evolution, but before dealing with the deviations, one must have a notion of what is typical. This statement is also true for other aspects of convective storms. The spectacular cloud structures of the Fargo storm depicted in Fujita (1960) have turned out to be relatively common with supercell thunderstorms and have been incorporated in Fig. 4, which summarizes the "classical" visual features of a supercell.
By virtue of providing detailed documentation of severe storm phenomena, storm intercept has been important in evaluating other sensing systems, notably Doppler radar. In fact, Rotunno (1984) has suggested that Doppler radar and storm interception together have been largely responsible for recent significant progress in understanding tornadogenesis. Another important contribution has been in the research leading to the identification of the Doppler radar-derived Tornado Vortex Signature (or TVS -- see Burgess et al., 1975). Originally called Gate-to-Gate Shear, visual observation of the Union City tornado made it clear that the radar velocity signature was collocated with the tornado, hence the terminology change. This has had obvious implications about the use of Doppler radar in tornado detection. Another research area making extensive use of the visual observations is the storm electricity program at NSSL (see Rust et al., 1981).
Finally, chase teams have identified a host of phenomena which either were in doubt or previously unknown. The first photography of an unambiguously anticyclonic tornado was obtained by storm chasers (Burgess, 1976). Brief, weak vortices occurring along outflow boundaries (the so-called "gustnadoes") have been seen repeatedly (Fig. 5), and their occurrence frequency suggests that this is not a rare event. A severe storm structure has been identified (Fig. 6) which has not been discussed previously, the so-called "dryline" or "low-precipitation storm (see Davies-Jones et al., 1976). Recent studies (Weisman and Klemp, 1984; Bluestein and Parks, 1983) have indicated that this may be a low-precipitation version of a supercell storm. This illustrates well how visual observations and convection models can interact, leading to improved understanding.
C. Quantitative field observations
1. Photogrammetry
The most quantitative investigations growing out of storm intercept have been those using photogrammetry. As mentioned previously, the original intercept goal of high-resolution debris cloud movies has proven difficult. However, there has been progress in this direction as well. Reports by Golden and Purcell (1978a) and Lee et al. (1981) exemplify this work. These efforts have made important contributions to our present perception of maximum tornadic windspeeds (see Golden, 1976), especially when combined with other independent measurements; notably, Doppler radar (see Hennington et al., 1982).
In addition, photogrammetric analysis has led to insights into tornadic airflow, as shown by Golden and Purcell (1977), Lee et al. (1981), or Rasmussen (1982). The qualitative nature of this flow is certainly as important as the absolute speed measurements in terms of knowing the applicability of theoretical and laboratory models (e.g., Davies-Jones,1976; Lewellen, 1976; Rotunno, 1977) to real tornadoes.
Although photogrammetric analysis of storm features other than the tornado has not had much emphasis, the potential is there to learn about storm flows on scales larger than the tornado. Holle (1982) has given a summary of some of the myriad possibilities inherent in analysis of the photographic data.
2. Instruments in the field
From the outset of the chase program, there have been sporadic efforts to bring one or more quantitative measurement devices into the field. In fact, one of the original notions behind the program was to drive an instrumented, armored vehicle through the tornado itself, a somewhat exaggerated reflection of the desire for quantitative data. While there are clearly many difficulties, the desire to obtain some sort of in-situ measurements continues unabated. Making direct measurements from mobile platforms is not easy, as those making airborne observations long have known. Some of the problems to be faced are: keeping accurate track of position and time for the data collected, accounting for vehicle motion where appropriate, calibration of instruments, exposure of sensors, jostling and shock associated with traveling vehicles, recording the data, etc.
In spite of the problems, efforts have been made. Early in 1973, the NSSL team was to try to fire chaff rockets (for tracing air motion using Doppler radar) into the tornado. This effort failed and was never followed up. Numerous chasers have carried sling psychrometers with them to monitor temperature and moisture, but the observations have generally not been recorded nor much sought after. In 1975, instrumented chase vehicles were purchased from the University of Wyoming for NSSL use, but to our knowledge little (if any) of the data have been put to use. Recently, a portable instrument package has been developed and deployed (Bluestein and Bedard, 1982), designed to withstand tornadoes and gather data within and near the vortex. To this date, the device has not been within the tornado proper, although some near-misses have occurred. Colgate (1982) has attempted to fire small instrumented rockets into a tornado from a chase aircraft, but a host of problems have prevented his success to date.
It is our view that the scarcity of quantitative intercept data reflects the lack of any real commitment to obtain such data. This seems to stem in part from the real difficulties in such an effort. However, there may well be a lingering aura of illegitimacy associated with storm chasing, which might inhibit a commitment to support such an ambitious (and unconventional) program. Clearly, we hope that such obstacles may eventually be overcome, as it seems to us that much could be gained from quantitative data obtained by field teams in and around severe convection. To this we should add that the avenue of multiple camera (stereo) photogrammetry has never received adequate exploration for this purpose (severe storm depiction), but we feel that it offers some promise worth investigating.
A. Forecasting methods
As suggested in Doswell et al. (1981), basic and applied research activities often make their most rapid advances when they have an opportunity to interact. In the meteorology of convective storms, it is virtually impossible to be involved with forecasting and not ask oneself questions of a basic scientific nature. Our current understanding of convective weather systems has too many gaps to suggest that failures in forecasting convection can be attributed entirely to imperfect application of scientific knowledge. Therefore, when discussing the impact of storm chasing on operations, there is only a shift in emphasis from the preceding section. We think it appropriate to consider research and operations as components of meteorological science, rather than as science and non-science.
One unforeseen consequence of participation in the intercept programs of the southern Great Plains has been the fanning out of the participants into various organizations interested in forecasting, public and private. These individuals have brought their experience and expertise with them to their new forecasting (and/or forecasting research) jobs. Thus, for example, the study by Tegtmeier (1974) has not only influenced research but has also seen application in the field. Doswell's (1982) presentation of operational convective storms meteorology has drawn heavily from intercept experience.
It is probably safe to say that field forecasters have relatively little up-to-date information with which to approach the severe storm forecasting problem. When the knowledge base available to severe storm intercept "veterans" has been put to use in the operational environment (e.g., Moller, 1982), it has been our experience that it can alleviate some of the challenges facing operational forecasters. Of course, the storm chasers do not invariably make perfect forecasts/warnings, but the techniques and experience which led to success in storm intercepting are certainly useful in operational forecasting.
B. Spotter training
New national severe weather spotter training programs are the most visibly successful outgrowth of intercept operations. It was recognized rather early that certain visual cues enabled the teams to determine which storms were likely to be severe/tornadic and to locate that part of the storm where the phenomena would occur. The original works of Ward and Bates were the starting point for developing these techniques, which have been developed well beyond those beginnings because of the wide range of chase experience. That this information would be valuable to storm spotters was readily apparent. With time, the observations were incorporated into a spotter movie, then a slide series designed to supplement the movie (Lemon et al., 1980), and finally a guide summarizing the material in printed form (NOAA, 1981).
The basic generality of the observations vis-a-vis severe convection has been verified many times. Naturally, there may well be some regional variations in the details, but one must accept the fact that a supercell storm in North Dakota is virtually identical in basic structure to one in Mississippi. Climatology suggests that the storm in Mississippi may be more likely to be obscured from easy viewing at a distance by low cloudiness and haze than the North Dakota event. Also, supercell storms are more likely to occur in Oklahoma than in Maryland. However, it is inconceivable that meteorological physics can be different in different parts of the world, and so it is not surprising that many of the cloud features seen in the southern Great Plains occur in storms elsewhere.
With the scientific authority of NSSL behind the project, the new spotter film entitled "Tornado: A Spotter's Guide" was an immediate success and remains popular and useful today. As one might expect, some portions may need revision and updating in light of more recent experience. Nevertheless, it continues to be relevant and vastly superior to its predecessors.
Given the movie's success, it was natural to want to include more detail than is possible in a short film. This led to the slide series supplement (Fig. 7) by Lemon et al. (1980). Slide programs for spotter training have traditionally been assembled by local National Weather Service personnel. While this is advantageous for local impact, the available resources and detailed knowledge of severe storms often were insufficient for this important task. The slide series was created in part to fill this void. Local offices retain the option (and rightly so!) to modify the presentation to make it more suitable for local needs. However, they now have a wide variety of material available that is consistent with the film and technically correct. The most recent versions of the "Spotter's Guide" (beginning with NOAA, 1981) have drawn from the film and slide series, so a spotter can keep a printed version of the distilled essence of the material.
Although it is impossible to state quantitatively what the effect of this coordinated spotter training program has been nationally, there are some clear qualitative indications. The disaster survey team which investigated the 10 April 1979 Red River Valley tornado outbreak (Disaster Survey Team, 1980) said:
Both the film and the slide series are contributing significantly to the spotter training program. In fact, the film (released more than 2 years ago) has been widely used by NWS and Civil Defense people and has been purchased by more than 200 TV weathercasters, emergency service directors, educators, and others across the country. There has been nearly unanimous praise for it, and people have asked NWS to develop additional films and slide presentations of this type.
Other positive results have been reported by Moller (1978). We feel that the new program has been directly responsible for saving lives and reducing the extent of severe weather-related injuries. We also believe that this new material has reduced significantly the undue alarm resulting from menacing but relatively benign storm events. In effect, the many "failures" during intercept attempts have had substantial value through identification of cloud structures associated with non-severe (or only marginally severe) forms of convection.
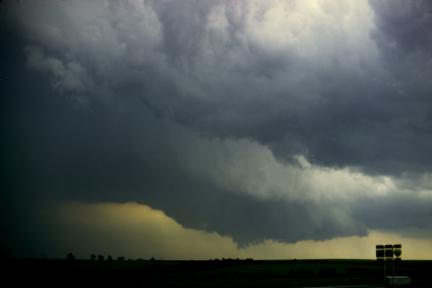
There are several important reasons for the success of the new spotter training program. One is that the material emphasizes common precursor cloud features, especially the wall cloud (Fig. 8). Thus, the spotter can anticipate severe weather events, rather than simply reacting to them once underway. Also, the program provides some sense of the variations seen from storm to storm, rather than showing only ideal cases. Spotters are urged to attempt to understand the overall storm structure as a key to assessing the potential severity of the storm. Finally, the time spent on recognition of cloud features associated with relatively weak storms is an important feature of the new program. Credibility of the training and of the input to the warning system by spotters trained with this material depends on two things: reliable detection of severe events and the reduction of false alarms. Thus, a significant part of the program deals not only with tornado look-alikes, but also gives specific details about how relatively non-threatening storms differ from their intense counterparts. We believe that those presenting this material should not underestimate the ability of their trainees to grasp this material - there is considerable evidence to the contrary and we do not believe in "talking down" to spotters. Further, we do not recommend too drastic an abridgment of the content in the interest of brevity. It is difficult to see how one would entrust the lives of a community to spotters given less than three hours of annual training. Thus, the full program of slides and film is designed to require roughly three hours to present, over and above any time spent describing the local "chain of command" and specific spotter procedures. A shorter version of the slide program has been developed for public information presentations, but it is not intended for formal spotter training.
We feel that if the new spotter training programs were the only thing of merit to come out of the intercept experience, it would already have repaid the investment in time and money many times over.7 The fact that visual observations by storm intercept teams can provide beneficial input to other aspects of convective storms meteorology only underscores the value of such information.
Essential to understanding the intercept program is the realization that people desiring to experience severe thunderstorms firsthand are driven by an intense desire to understand how they work and what makes them happen. There are too many questions which cannot be answered by indirect experience, by relying on the observations of others, or by the purely quantitative responses of unfeeling, uncomprehending instruments. In some ways, this is analogous to the exploration of extraterrestrial space - there can be little doubt that landing humans on Mars would increase the range of discovery over that possible with mechanical sensors alone. The exclusive use of remote probing in extraterrestrial space is dictated more by cost than by scientific needs.
Without realizing it at the start, storm chasers have had an opportunity to experience weather on a wide range of scales in a unique way. The feedback of actually experiencing the weather that develops after having made a forecast is a direct learning process available no other known way. No severe storm intercept team member has ever been able to ignore processes at scales above the storm scale - they are too important in determining the outcome of the chase. Thus, even when the motivation is dominated by an interest in the storm scale events alone, there are compelling reasons to be involved in forecasting. Potentially fruitful forecasting research is a natural by-product of storm chasing.
Those who have participated, on their own and/or as part of a formal program, have operated on the far frontiers of meteorological science. Much of their common knowledge base remains undocumented in the formal scientific literature. Having suggested some reasons for this, we wish to urge the scientific community to be more willing to recognize the value of these observations. Most of the common lore of storm chasers has survived a far more stringent examination than peer review: the unforgiving march of real storm events.
In discussing the value of intercepting storms to meteorological science, it is also important to recognize that quantitative testing is not the sole means by which our science proceeds. While this article is not the forum to discuss the history and philosophy of science, we operate on the assumption that formulating new scientific theories often proceeds on the basis of relatively flimsy evidence. It can be a creative, intuitive process that depends figuratively, and perhaps literally in our case, on the scientist's vision. One need only refer to our change in perception of large-scale weather systems as a result of geosynchronous satellite imagery to see the importance of qualitative, visual input to the creative process. This in no way disregards the importance of hard, quantitative verification of those perceptions. We support efforts to obtain quantitative information, but we cannot accept the notion that its absence means that storm intercept visual information has no place in our science.
It is our view that the body of meteorological knowledge has been increased substantially as a result of the storm intercept program in the Southern Plains. This is not a resource to be casually dismissed; rather, it is an asset that should be explored and encouraged to grow. Finally, we wish to leave our readers with the following provocative thought (Krutch, 1969):
One is not compelled to remain always standing before the picture frame, or confined to the spectator's side of the proscenium...From no mere canvas does the wind actually blow; there is no poem from which a snowflake can detach itself to melt upon the cheek. From every man-made poem, or picture, or drama, one is to some extent excluded...But of nature's poems and pictures we are invited to become a part.
The authors appreciate the suggestions and review of this manuscript by Dr. S.L. Barnes (WRP) and Mr. John F. Weaver (NOAA/NESDIS). Stimulating conversations with them and with Mr. Morris Weisman (NCAR) have contributed significantly to this article.
Bates, F.C., 1963: An aerial observation of a tornado and its parent cloud. Weather, 18, 12-18.
Bluestein, H.B., 1980: The University of Oklahoma severe storms intercept project -- 1979. Bull. Amer. Meteor. Soc., 61, 560-567.
________, and A.J. Bedard, Jr., 1982: Surface meteorological observations in severe thunderstorms: Field measurements and design detail of TOTO. Preprints, 12th Conf. Severe Local Storms (San Antonio, TX), Amer. Meteor. Soc., Boston, 383-395.
_________, and C.R. Parks, 1983: A synoptic and photographic climatology of low-precipitation severe thunderstorms in the southern plains. Mon. Wea. Rev., 111, 2034-2046.
Browning, K.A., and G.B. Foote, 1976: Airflow and hail growth in supercell storms and some implications for hail suppression. Quart. J. Roy. Meteor. Soc., 102, 499-533.
Burgess, D.W., 1976: Cover story for issue no. 4. Weatherwise, 29, p. 167.
__________, L.R. Lemon, and R.A. Brown, 1975: Evolution of a tornado signature and parent circulation as revealed by single Doppler radar. Preprints, 16th Conf. Radar Meteorology (Houston, TX), Amer. Meteor. Soc., Boston, 99-106.
Byers, H.R., and R.R. Braham, 1949: The Thunderstorm. U.S. Government Printing Office, Washington, D.C., 287 pp.
Colgate, S.A., 1982: Small rocket tornado probe. Preprints, 12th Conf. Severe Local Storms (San Antonio, TX), Amer. Meteor. Soc., Boston, 396-400.
Darkow, G.L., V.E. Soumi, and P.M. Kuhn, 1958: Surface thermal patterns as a tornado forecast aid. Bull. Amer. Meteor. Soc., 39, 532-537.
Davies-Jones, R.P., 1976: Laboratory simulations of tornadoes. Proceedings, Symp. on Tornadoes, Assessment of Knowledge and Implications for Man (Lubbock, TX), Institute for Disaster Research, Texas Tech. Univ., Lubbock, TX, 151-174.
_________, 1982a: Tornado interception with mobile teams. Thunderstorms: A Social, Scientific and Technological Documentary. Vol. 3: Instruments and Techniques for Thunderstorm Observation and Analysis (E. Kessler, ed), U.S. Dep't of Commerce/NOAA/ERL, 33-46.
_________, 1982b: Tornado dynamics. Thunderstorms: A Social, Scientific and Technological Documentary. Vol. 2: Thunderstorm Morphology and Dynamics (E. Kessler, ed.), U.S. Dep't of Commerce/NOAA/ERL, 297-361.
_________, 1982c: Observational and theoretical aspects of tornadogenesis. Topics in Atmospheric and Oceanographic Sciences: Intense Atmospheric Vortices (Bengtsson/Lighthill, ed's), Springer-Verlag, Berlin, 175-189.
_________, and J.H. Golden, 1975: On the relation of electrical activity to tornadoes. J. Geophys. Res., 80, 1614-1616.
_________, D.W. Burgess and L.R. Lemon, 1976: An atypical tornado-producing cumulonimbus. Weather, 31, 336-347.
_________, ________, ________, and D. Purcell, 1978: Interpretation of surface debris patterns from the 24 May 1973 Union City, Oklahoma tornado. Mon. Wea. Rev., 106, 12-21.
Disaster Survey Team, 1980: Red River Valley tornadoes of April 10, 1979: A report to the administrator. NOAA Disaster Survey Report 80-1, Rockville, MD, 60 pp.
Donaldson, R.J., Jr., A.A. Spatola, and K.A. Browning, 1965: Visual observations of severe weather phenomena. AFCRL Special Report No. 32 (K.A. Browning, ed.): A family outbreak of severe local storms -- A comprehensive study of the storms in Oklahoma on 26 May 1963, Part I, U.S. Air Force Office of Aerospace Research [NTIS #AD 623787], 73-97.
Doswell, C.A. III, 1977a: Obtaining meteorologically significant divergence fields through the filtering property of objective analysis. Mon. Wea. Rev., 105, 885-892.
_________, 1977b: Subsynoptic scale dynamics of severe local storms: A case study. Preprints, 10th Conf. Severe Local Storms (Omaha, NE), Amer. Meteor. Soc., Boston, 511-514.
_________, 1982: The operational meteorology of convective weather. Vol. I: Operational mesoanalysis. U.S. Dep't of Commerce/NOAA Tech. Memo. NWS NSSFC-5, 158 pp.
_________, 1983: Comments on "Photographic documentation of some distinctive cloud features observed beneath a large cumulonimbus." Bull. Amer. Meteor. Soc., 64, 1389-1390.
_________, L.R. Lemon, and R.A. Maddox, 1981: Forecaster training -- A review and analysis. Bull. Amer. Meteor. Soc., 62, 983-988.
Eskridge, R.E., and P. Das, 1976: Effect of a precipitation-driven downdraft on a rotating wind field: A possible trigger mechanism for tornadoes? J. Atmos. Sci., 33, 686-694.
Fankhauser, J.C., 1971: Thunderstorm-environment interactions determined from aircraft and radar observations. Mon. Wea. Rev., 99, 171-192.
_________, G.M. Barnes, L.J. Miller, and P.M. Roskowski, 1983: Photographic documentation of some distinctive cloud features observed beneath a large cumulonimbus. Bull. Amer. Meteor. Soc., 64, 450-462.
Fujita, T., 1960: Detailed analysis of the Fargo tornadoes of 20 June 1957. U.S. Weather Bureau Res. Paper No. 42, Univ. of Chicago, 67 pp.
Golden, J.H., 1974: On the life cycle of Florida Keys' waterspouts. J. Appl. Meteor., 13, 676-692.
_________, 1976: An assessment of windspeeds in tornadoes. Proceedings, Symp. on Tornadoes Assessment of Knowledge and Implications for Man (Lubbock, TX), Institute for Disaster Research, Texas Tech. Univ., Lubbock, TX, 5-42.
_________, and B.J. Morgan, 1972: The NSSL/Notre Dame tornado intercept program. Bull. Amer. Meteor. Soc., 53, 1178-1179.
_________, and D. Purcell, 1977: Photogrammetric velocities for the Great Bend, Kansas tornado of 30 August, 1974: Accelerations and asymmetries. Mon. Wea. Rev., 105, 485-492.
_________, and ________, 1978a: Life cycle of the Union City, Oklahoma tornado and comparison with waterspouts. Mon. Wea. Rev., 106, 3-11.
_________, and _________, 1978b: Airflow characteristics around the Union City tornado. Mon. Wea. Rev., 106, 22-28.
Hennington, L., D. Zrnic', and D.W. Burgess, 1982: Doppler spectra of a maxi-tornado. Preprints, 12th Conf. Severe Local Storms (San Antonio, TX), Amer. Meteor. Soc., Boston, 433-436.
Hoecker, W.H., Jr., 1960: Wind speed and air flow patterns in the Dallas tornado of 02 April 1957. Mon. Wea. Rev., 88, 167-180.
Holle, R., 1982: Photogrammetry of thunderstorms. Thunderstorms: A Social, Scientific and Technological Documentary. Vol. 3: Instruments and Techniques for Thunderstorm Observation and Analysis (E. Kessler, ed.), U.S. Department of Commerce/NOAA/ERL, 77-98.
Kelly, D.L., J.T. Schaefer, R.P. McNulty, C.A. Doswell III, and R.F. Abbey, Jr., 1978: An augmented tornado climatology. Mon. Wea. Rev., 106, 1172-1183.
Krutch, J.W., 1969: Baja California and the Geography of Hope. Sierra Club-Ballantine Books, San Francisco, p. 74.
Lee, J.T., D.S. Zrnic', R.P. Davies-Jones, and J.H. Golden, 1981: Summary of AEC-ERDA-NRC supported research at NSSL 1973-1979. U.S. Dep't of Commerce/NOAA Tech. Memo. ERL NSSL-90, 93 pp.
Lemon, L.R., 1976: The flanking line, a severe thunderstorm intensification source. J. Atmos. Sci., 33, 686-694.
_________, and C.A. Doswell III, 1979: Severe thunderstorm evolution and mesocyclone structure as related to tornadogenesis. Mon. Wea. Rev., 107, 1184-1197.
_________, D.W. Burgess, and R.A. Brown, 1978: Tornadic storm airflow and morphology derived from single-Doppler measurements. Mon. Wea. Rev., 106, 48-61.
_________, C.A. Doswell III, A.R. Moller, and D.K. Hoadley, 1980: A slide series supplement to "Tornado: A Spotter's Guide." NOAA/National Weather Service, Washington, D.C.
Lewellen, N.S., 1976: Theoretical models of the tornado vortex. Proceedings, Symp. on Tornadoes Assessment of Knowledge and Implications for Man (Lubbock, TX), Institute for Disaster Research, Texas Tech. Univ., Lubbock, TX, 107-144.
Ludlam, F.H., 1963: Severe local storms: A review. Meteor. Monogr., 5, No. 27, Amer. Meteor. Soc., Boston, 1-30.
_________, 1976: Aspects of cumulonimbus study. Bull. Amer. Meteor. Soc., 57, 774-779.
Maddox, R.A., and C.A. Doswell III, 1982a: Forecasting severe thunderstorms: A brief consideration of some accepted techniques. Nat. Wea. Dig., 7, 26-30.
_________, and _________, 1982b: An examination of jet stream configurations, 500 mb vorticity advection and low level thermal advection patterns during extended periods of intense convection. Mon. Wea. Rev., 110, 184-197.
Marwitz, J.D., 1972: The structure and motion of severe hailstorms. Part I: Supercell storms. J. Appl. Meteor., 11, 166-179.
Means, L.L., 1944: The nocturnal maximum occurrence of thunderstorms in the Midwestern states. Misc. Rep't No. 16, Dep't of Meteor., Univ. of Chicago, 38 pp.
Moller, A.R., 1978: The improved NWS storm spotter's training program at Ft. Worth, TX. Bull. Amer. Meteor. Soc., 59, 1574-1582.
_________, 1982: A record-breaking severe thunderstorm event in north Texas. Preprints, 9th Conf. Wea. Forecasting and Analysis (Seattle, WA), Amer. Meteor. Soc., Boston, 396-401.
_________, 1983: Comments on "Photographic documentation of some distinctive cloud features observed beneath a large cumulonimbus. Bull. Amer. Meteor. Soc., 64, 1390-1391.
_________, C. Doswell, J. McGinley, S. Tegtmeier, and R. Zipser, 1974: Field observations of the Union City tornado in Oklahoma. Weatherwise, 27, 68-77.
National Storm Program, 1984: Storm-Central Phase: Preliminary program design. Planning Document prepared for the Interagency Team for STORM-Central (E. Zipser, Chairman), National Center for Atmospheric Research, Boulder, CO, 147 pp.
Nelson, S.P., 1977: Rear flank downdraft: A hailstorm intensification mechanism. Preprints, 10th Conf. Severe Local Storms (Omaha, NE), Amer. Meteor. Soc., Boston, 521-525.
NOAA, 1981: Spotter's guide for identifying and reporting severe local storms. U.S. Gov't Printing Office, Washington, D.C., 15 pp.
Rasmussen, E.N., 1982: The Tulia outbreak storm: Mesoscale evolution and photogrammetric analysis. M.S. Thesis, Texas Tech. Univ., Lubbock, TX, 180 pp.
Rotunno, R., 1977: Numerical simulation of a laboratory vortex. J. Atmos. Sci., 34, 1942-1956.
_________, 1984: Tornadoes and tornadogenesis. AMS Intensive Short Course on Mesoscale Meteorology, Amer. Meteor. Soc., Boston.
Rust, D.L., W.L. Taylor, D.R. MacGorman, and R.T. Arnold, 1981: Research on electrical properties of severe thunderstorms in the Great Plains. Bull. Amer. Meteor. Soc., 62, 1286-1293.
Sasaki, Y., and S.A. Tegtmeier, 1974: An experiment of subjective tornadic storm forecasting using hourly surface observations. Preprints, 5th Conf. Wea. Forecasting and Analysis (St. Louis, MO), Amer. Meteor. Soc., Boston, 276-279.
Schaefer, J.T., D.L. Kelly, C.A. Doswell III, J.G. Galway, R.J. Williams, R.P. McNulty, L.R. Lemon, and B.D. Lambert, 1980: Tornadoes: When? Where? How often? Weatherwise, 33, 52-59.
Tegtmeier, S.A., 1974: The role of the surface, subsynoptic low pressure system in severe weather forecasting. M.S. Thesis, Univ. of Oklahoma, Norman, OK, 66 pp.
Vonnegut, B., 1960: Electrical theory of tornadoes. J. Geophys. Res., 65, 203-212.
Ward, N.B., 1961: Radar and surface observations of tornadoes on May 4, 1961. Proceedings, 9th Weather Radar Conf. (Kansas City, MO), Amer. Meteor. Soc., Boston, 175-180.
Weisman, M.L. and J.B. Klemp, 1984: The structure and classification of numerically simulated convective storms in directionally varying wind shears. Mon. Wea. Rev., 112 (in press).
Weiss, S.J., 1977: Objective verification of the severe weather outlook at the National Severe Storms Forecast Center. Preprints, 10th Conf. Severe Local Storms (Omaha, NE), Amer. Meteor. Soc., Boston, 395-402.
Whiting, R.M., and R.E. Bailey, 1957: Some meteorological relationships in the prediction of tornadoes. Mon. Wea. Rev., 85, 141-150.
Figure 1. Example of a cumulonimbus cloud, taken in the eastern Texas panhandle on 27 May 1977, looking toward the southeast from a distance of about 35 miles. Photograph © 2004 C. Doswell
Figure 2. Map of Southern Plains storm chase operations area,
with several cities mentioned in the text noted, near the filled-in
circles. Blue open circles locate standard surface stations, labeled
with their conventional identifiers (in blue). Location of NSSL is
the open circle in green. Interstate highways are indicated, as are
state boundaries. Independent chase efforts have included a much
wider range.
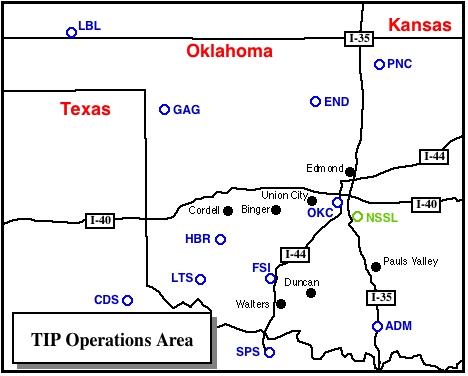
Figure 3. Schematic example of a subysnoptic weather system that
includes both the SSL and DLB (from Moller 1979 -- see text). Areas
of significant severe weather threat are indicated by stippling.
Figure 4. Schematic of the appearance of a supercell tornadic
thunderstorm as it approaches a ground observer (from Lemon et al.,
1980).
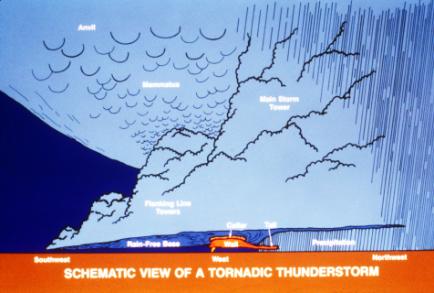
Figure 5..An example of an outflow boundary which is producing
several "gustnadoes" along its leading edge.This storm occurred near
Welch, TX on 23 May 1982. Photograph © 1982 C. Doswell
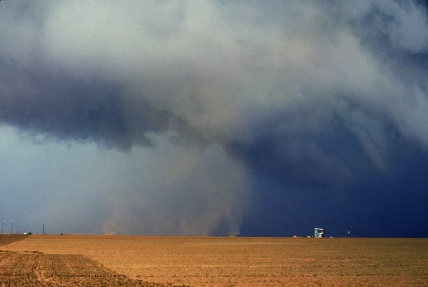
Figure 6. Example of a "dryline" or "low-precipitation"- type
tornadic supercell near Borger, TX on 4 June 1982. [Note added
later: It's likely that this storm would appear to be a
"classic" supercell on radar.] Fhotograph © 1982 A.R.
Moller (used by permission)
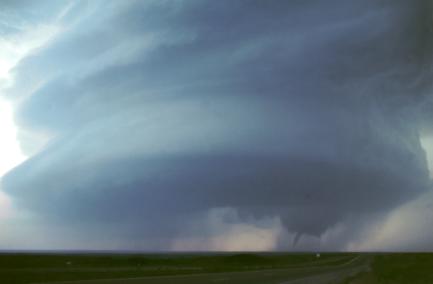
Figure 7. Title slide from the slide program developed by Lemon
et al. (1980).
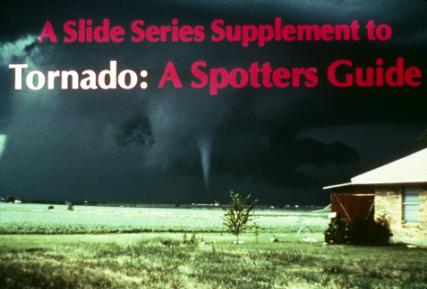
Figure 8. View from the northwest of a wall cloud near Union
City, OK on 24 May 1973 which produced a tornado about 20-25 min
later. Note the heavy precipitation on the left of the picture, ahead
and to the left of the storm's track. The wall cloud was undergoing
rapid changes in form and rotating visibly. Photograph © 2004 C.
Doswell
1 Severe storm cloud features (as noted by the Oklahoma-based intercept teams) are discussed below. Terminology for convective cloud structures remains a problem (see Fankhauser et al., 1983; Doswell, 1983; and Moller, 1983).
2 Those that have include: David Hoadley, Jim Leonard, Gene Moore, Eddie Simms, and Roger Jensen. Such individuals are known to have been "storm chasing" prior to (or during, but at the time unknown to) the formal intercept teams in Oklahoma. Dave Hoadly has, for the past several years, been issuing a regular newsletter ("Storm Track") for storm chasers as an informal medium for exchanging information.
3 Nor were there numerous tornadoes nationwide. However, it should be apparent that in any given year, a given state will not always share proportionately in relative abundance (or scarcity) of a weather event during that year.
4 It should also be noted that some were convinced that storm chasing was not for them.
5 It is an interesting coincidence that there were also three field teams for the tornadic storm described by Donaldson et al. (1965), but in the Union City storm event, their placement was not by accident.
6 For examples, see Ludlam (1976), Browning and Foote (1976), and Marwitz (1972).
7 No matter how good the training material is, if it is not presented, it can have no effect. Thus, we wish to recognize the efforts of local National Weather Service staffs in their preparedness programs. Without their contributions, the severe storm spotter program could not be successful.