For many research subjects in meteorology, it's common to have less data than is desired. Tornado-related research, in particular, has many topics where sample sizes are insufficient to draw certain types of conclusions. There are many reasons for this to be an issue when studying the historical record of tornado occurrences, but at times the sheer size of the dataset might convince the unwary that it's large enough to draw robust conclusions, whereas that may not necessarily be the case.
The concept of sample size is certainly related to the sheer number of observations, but unfortunately, as discussed in statistical textbooks (e.g., Wilks 1995), the number of observations can be deceptive when considering how adequate the sample is for drawing certain conclusions. The key notion in understanding how adequate the sample is for a particular purpose is to consider the variability contained within the data. For observations with low variability, the number of observations for adequate sampling is much lower than for observations with high variability.
Some of the notions in this paper are discussed in various other places - notably in Brooks et al. (2003) and elsewhere.
In order to provide a concrete example of how to recognize problems associated with small sample sizes, I consider the database on occurrence of tornadoes that is maintained by the Storm Prediction Center (SPC). These data are described in detail elsewhere (e.g., Schaefer and Edwards 1999) and some of the important caveats about them have also been mentioned in previous applications (e.g., Brooks et al. 2003, hereinafter BDK03). As part of a project concerning tornado outbreaks that is being done at the SPC, it was decided to use recent historical tornado occurrence data, for the period 1970-2002. As discussed in BDK03, there are pronounced secular trends in the tornado occurrence data, i.e., trends that are virtually certain to have a non-meteorological origin. The farther back in time one goes with tornado occurrence data, the more influential these undesirable trends become on any quantitative analysis of the data. Hence, it was felt that a 33-year record of recent vintage was about as long a record as one could trust to be influenced as little as possible by such secular trends.
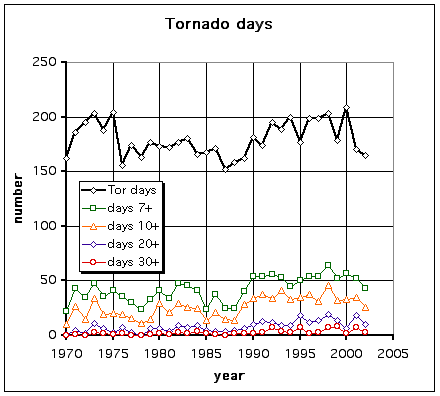
In order to search out tornado outbreaks, an arbitrary choice was made: we would begin the search by identifying all days with seven or more reported tornadoes in the record. During the 33-year period of record, it was found that there were nearly 1400 such days, which comprises on the order of 10 percent of all dates within that time period. As already suggested, this might seem to the unwary to be a relatively large sample upon which to do analysis. Note that in any given year, a "tornado day" (i.e., a day with one or more reported tornadoes) includes roughly half of the days in a year (Fig. 1).
Figure 1. Number of tornado days (days with one or more reported tornadoes), as well as the number of days with 7 or more, 10 or more, 20 or more, and 30 or more reported tornadoes, during the period 1970-2002.
Days with seven or more reported tornadoes occur considerably less frequently than tornado days. As the figure shows, when the threshold is raised from seven to 10, 20, or 30 or more reported tornadoes in a day, the sample size decreases considerably. When considering only days with 7 or more tornadoes, a replot of Fig. 1 (in Fig. 2) reveals the likely presence of a secular trend in the data, with a substantial increase in the frequency of days with a given number of tornadoes, beginning in about 1990. This coincides with a rapid increase in the frequency of reported F0 (on the Fujita scale for rating tornado intensity) tornadoes beginning in 1990 (Fig. 3). The reasons for this are not clear. Thus, even though the 33-year period was chosen to minimize the impact of secular trends, it appears that even this most recent data do still contain such artifacts.
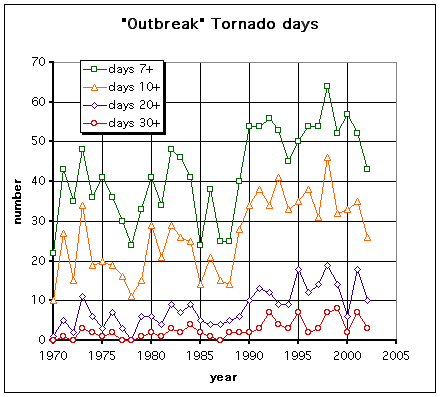
Figure 2. As in Fig. 1, except the number of tornado days has been omitted and the graph rescaled.
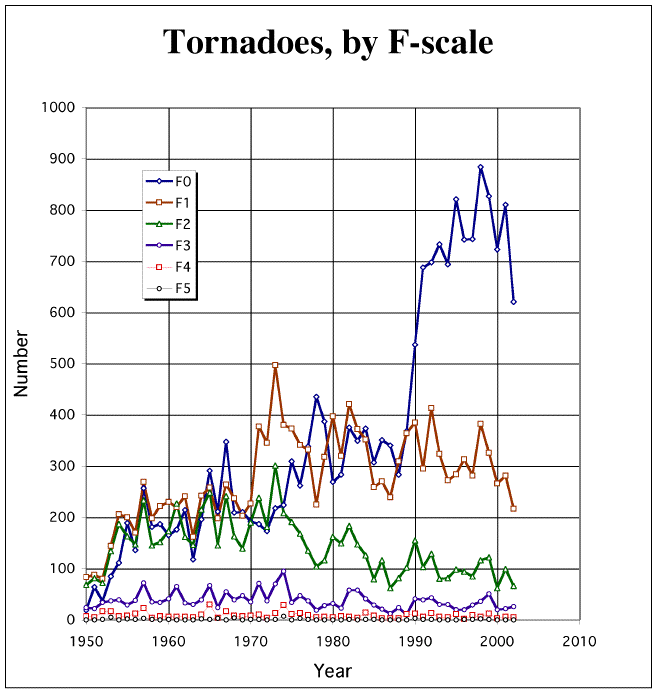
Figure 3. Time trends in the number of tornadoes, by F-scale for the period 1950-2003.
Now it's reasonable to speculate that over the course of a year, there's some underlying relatively smooth distribution of days with seven or more tornadoes. That is, if we had 1000 years of stable, reliable tornado occurrence observations, then when the frequency of such days were plotted as a function of the calendar date, we'd expect the result to be fairly smooth. However, as Fig. 4 clearly demonstrates, the resulting frequency plot is far from smooth. In fact, some dates, such as19 April, appear to have an anomalously high frequency compared to nearby dates on the calendar. And there are other dates, like 21 May, that have anomalous low frequencies. The problem becomes even more acute when the climatological frequency is low, because over the 33-year period, there are numerous dates in the fall and winter on which seven or more tornadoes did not occur at all, whereas nearby dates had several such occurrences..
It's possible to see some fairly obvious overall trends, nevertheless, and perhaps some smoothing scheme could be used to estimate the annual progression of the underlying frequency curve. One type of smoothing of the data is shown in Fig. 4 - the heaviest filtering (the 61-day Gaussian kernel) seems to produce a fairly smooth curve, which might represent a reasonable approximation to the unknown underlying smooth distribution. This curve is similar to that shown in BDK03 for tornado days as a function of the date. To what extent are the "wiggles" in the curve that remain in the less-smoothed versions of the data representative of some real variation in the frequency, as opposed to being unfiltered noise? Using the 33-year period of record, I assert that it's essentially not possible to know. Such a question can't be answered with this sample. For any given date on the calendar, the peak frequency is as large as roughly half of the years in the record, but for the low-frequency times of the year, a given date has at most about 2-3 occurrences in 33 years. This is just inadequate to describe the true frequency as a function of the date with any reasonable statistical confidence.
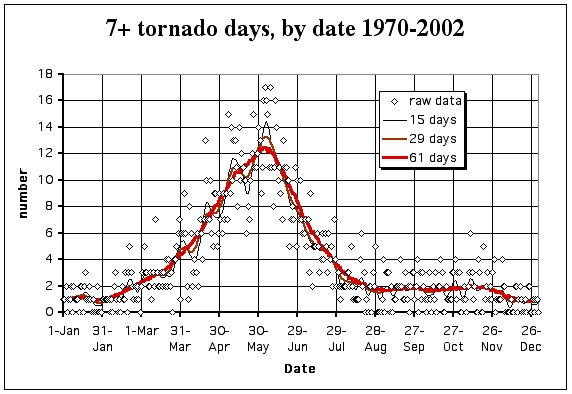
Figure 4. The number of days with 7 or more reported tornadoes during the period from 1970-2002, as a function of the calendar date (diamond-shaped points). The thin black line is the result of passing a 15-day Gaussian kernel through the data, the intermediate brown line is the result of using a 29-day Gaussian kernel, and the heavy red line is the result of using a 61-day Gaussian kernel.
There's surely no reason to believe that one date is particularly favored compared to nearby dates, even though the data seem to indicate this possibility. Any such claim that a date like19 April is "special" would be comparable to claiming the "special" character of the so-called "January thaw". The latter has been shown by Godfrey et al. (2002) to be virtually certain to be an illusion caused by what amounts to a small sample size, albeit not so extreme as shown in Fig. 4. The existence of high variability in the data when considering the frequency as a function of the calendar date is a clear indication of the inadequacy of the sample for such an analysis. If the threshold for consideration were raised to 10, or 20, or 30 reported tornadoes on a given day, the sample size problem would be even more pathological. Further, if the F-scale criterion were raised from any tornado (F0 or stronger) to some higher threshold, such as F2 and stronger, a similar drastic reduction in sample size would result, owing to the relative infrequency of strong tornadoes. Increasing the period of record could conceivably overcome the sample size problem, but for the tornado occurrence data, the non-meteorological artifacts in the data make this an option that would create at least as many problems as it would solve. The inescapable fact is that tornado events are rare events in any one place, and that means that our tornado occurrence data have very limited capability to sustain statistically viable conclusions.
The notion of the inadequacy of the 33-year period of record for looking at rare events like the occurrence of seven or more tornadoes on a given day, shouldn't be over-generalized, however. For certain types of analysis, if the data contain a strong signal, then the sample might still be used to provide meaningful results. As an example of this, during the preliminary analysis of the data regarding the occurrence of seven or more tornadoes on a given day, it was observed that during the peak of the "tornado season" in the United States (May and June), there was a marked tendency for event days (days with seven or more reported tornadoes) to occur in strings of consecutive days, whereas outside of the tornado season, it was noticeably more likely that an event day would be isolated rather than being part of a string of 2 or more consecutive days.
To reveal this strong signal, each event day was categorized by the length of the string of consecutive days in which it occurred. For each date in the calendar year, the number of times every event day was associated with a string of each length was counted. The categories used were: an isolated event (a "string" of one day), an event that was part of string of two or more days, or six or more days, and finally of 10 or more days. Additional sub-categories of 2-5 day string lengths, and 6-9 day string lengths were also counted. Using the raw results of this count as a function of the day of the year gave a relatively noisy result, but when a simple 15-day moving average was applied, the percentage of times event days occurring on a particular calendar date in each string length category revealed .a strong seasonal dependence (Fig. 5). In fact, outside of the May-June tornado season, strings of more than three consecutive event days simply did not occur in the 33-year period of record, whereas during the tornado season, strings of two or more event days were associated with around 70 percent of all event days. Event day strings of six or more days occurred exclusively during the tornado season. In fact, one string of 15 consecutive event days was observed! Thus, it appears that a strong seasonal dependence reveals itself when strings of consecutive event days are considered. Any quantitative analysis of the reasons for this strong signal is outside of the scope of this note, but it is probably associated with the seasonal evolution in shear- and buoyancy-related parameters. What this analysis does reveal, however, is that a sufficiently strong signal can emerge from relatively noisy data, but that when the data are used for other types of analysis, those same data constitute too small a sample to offer reliable results.
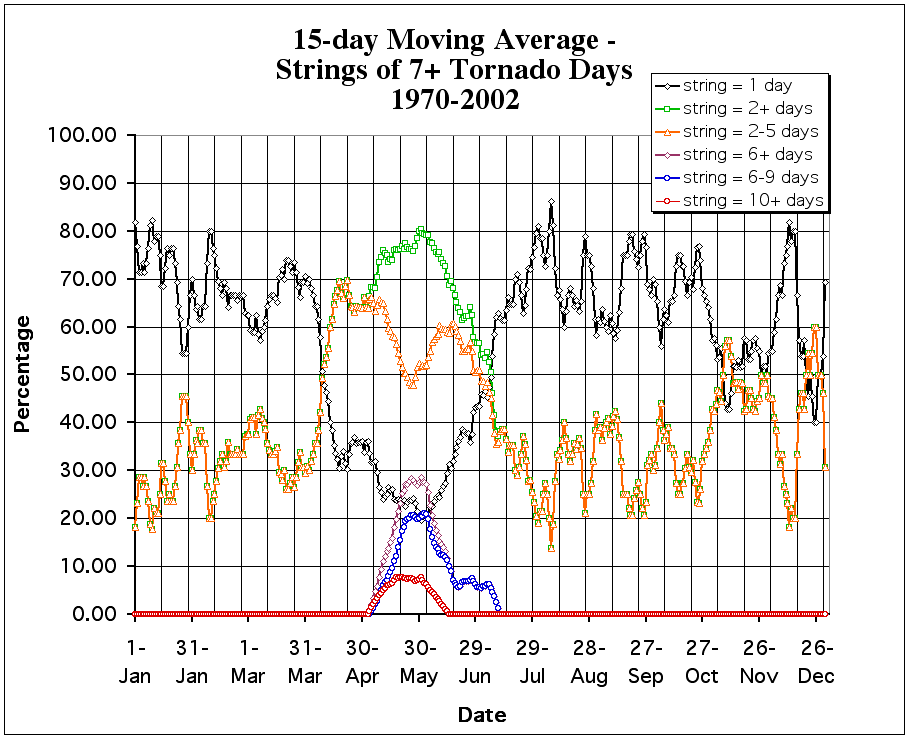
Figure 5. Results of passing a simple 15-point moving average filter through the counts of strings of event days (with seven or more reported tornadoes) as a function of the calendar date for strings of length: 1 day, 2 or more days, 2-5 days, 6 or more days, 6-9 days, and 10 or more days (see the key..
Figure 5 also hints at the presence of a fall tornado season (note the increase in the 2+ string frequency in November), but the signal is nowhere near so strong as it is in the spring. The fall season is more sporadic than the spring season, so to be more confident in any quantitative analysis, a larger sample would be necessary.
It's worth considering the "climatology" of such strings. The record shows (Fig. 6) that over the 33 years, there's been a slow increase in the number of tornado days, but the number of strings with 2 or more days of 7 or more tornadoes hasn't changed very much. It's also clear that the number of strings of more than 3-4 days is pretty small (Fig. 7) ... so small as to suggest that the sample size for strings of more than 4 days is inadequate to say much. The record contains one string of 10 consecutive days with 7+ tornadoes (11 May - 20 May 1982), and one with 15 consecutive days (24 May - 07 June 1980)! There were no strings of 9 days and none between 10 and 15.
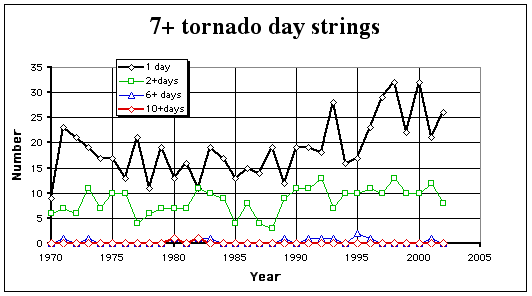
Figure 6. Number of strings of various lengths (see key) including "strings" of one day, by year.
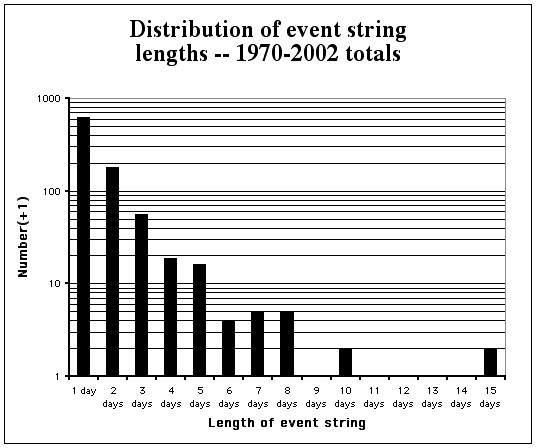
Figure 7. For the period 1970-2002, the number of strings of days with 7 or more reported tornadoes by the length of the string, in days. The use of a logarithmic scale requires that the number in each caregory be increased by one, to avoid having to take the logarithm of zero.
The tendency to draw unjustifiable conclusions from analysis of meteorological data is strong. Particularly vulnerable to this are attempts to relate tornado occurrence data to various large-scale processes, such as the ENSO cycle. Unfortunately, the tornado occurrence data suffer from numerous non-meteorological (secular) trends, which means that long periods of record contain artifacts that will be difficult to deconvolve from real meteorological information. Shorter periods of record can reduce the impact of these artifacts, but are likely to create small sample size problems, unless the signal being sought is strong enough to show through the noise associated with small sample sizes. These examples should serve as a caveat to anyone doing data analysis, but certainly are of greatest importance to those using tornado occurrence data.
Brooks, H. E., C. A. Doswell III., and M. P. Kay, 2003: Climatological estimates of local daily tornado probability for the United States. Wea. Forecasting, 18, 626-640.
Godfrey, C. M., D. S. Wilks, and D. M. Schultz, 2002: Is the January Thaw a statistical phantom? Bull. Amer. Meteor. Soc., 83, 53-62.
Schaefer, J. T., and R. Edwards, 1999: The SPC tornado/severe thunderstorm database. Preprints, 11th Conf. Appl. Climat., Dallas, TX, Amer. Meteor. Soc., 603-606.
Wilks, D, 1995: Statistical Methods in the Atmospheric Sciences: An Introduction. Academic Press, 467 pp.