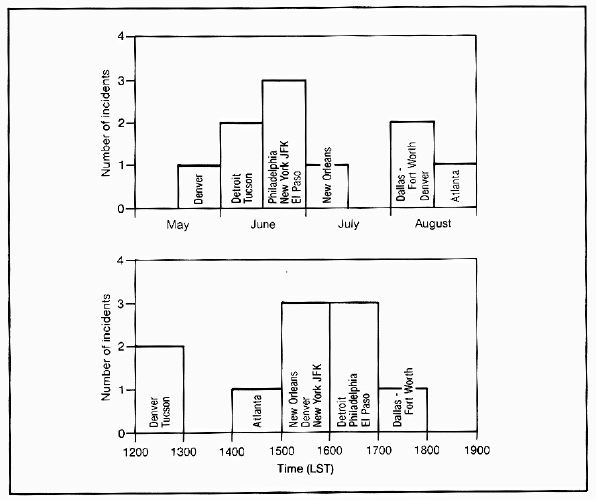
 Figure 1.
Locations and times of well-known aircraft accidents associated with
microbursts, 1975-1985.
Figure 1.
Locations and times of well-known aircraft accidents associated with
microbursts, 1975-1985._________
* Affiliations at the time of publication - All now retired from NOAA
Most recent update: 9 February 2011: Moved to my home website and updated
_________
NOTE #1: If there is no image shown for a caption, that image is unavailable for inclusion here.
NOTE #2: We gratefully acknowledge the permission granted by the copyright holders for the use of these images in this Web version of the Microburst Handbook. Any image not specifically noted as copyrighted is in the public domain, and can be used freely. Copyrighted images are indicated as such; please contact the image authors for information about any use of these images.
Figure 1.
Locations and times of well-known aircraft accidents associated with
microbursts, 1975-1985.
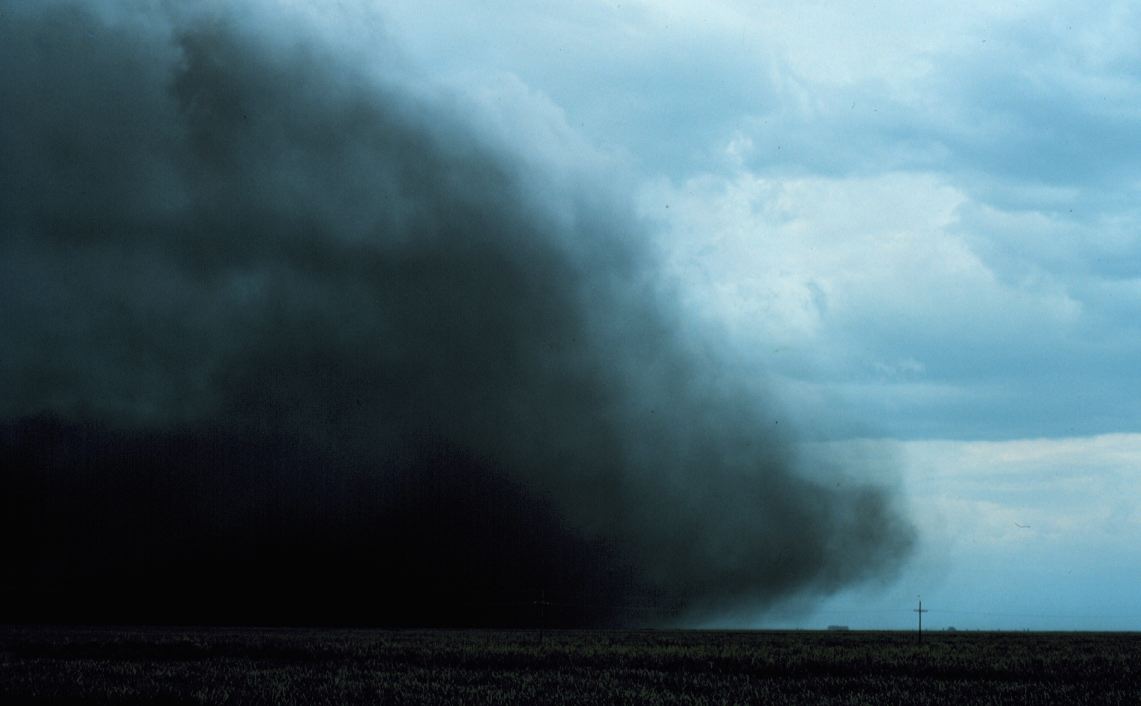 Figure 2. A
gust front photographed in South Florida during the Florida Area
Cumulus Experiment. The front, made visible by dust, is moving to the
right, where lifting is producing cumulus clouds (upper right). The
characteristic profile produced by the sinking of rain-cooled air
extends farther forward near the ground but is retarded at the
surface by friction. Gust fronts are much more widespread than
microbursts, often extending over tens of kilometers. (NOAA
Photograph, taken by Irv Watson)
Figure 2. A
gust front photographed in South Florida during the Florida Area
Cumulus Experiment. The front, made visible by dust, is moving to the
right, where lifting is producing cumulus clouds (upper right). The
characteristic profile produced by the sinking of rain-cooled air
extends farther forward near the ground but is retarded at the
surface by friction. Gust fronts are much more widespread than
microbursts, often extending over tens of kilometers. (NOAA
Photograph, taken by Irv Watson)
Figure 3a. A typical patch of microburst wind damage, produced by the Independence Day storm that moved across northern Wisconsin in 1977 (Fujita 1978). (Photograph ©1978, T.T. Fujita)
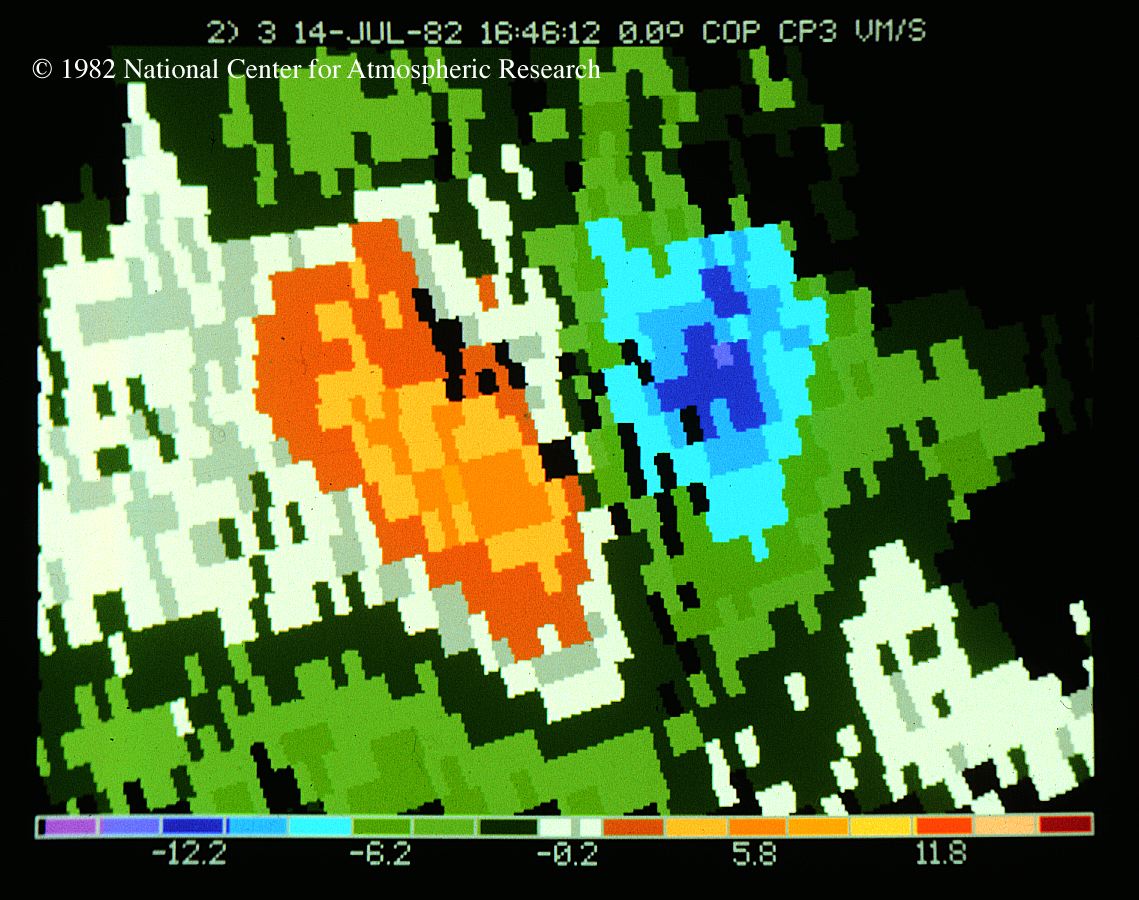 Figure 3b.
Typical appearance of a microburst on Doppler radar as observed
during the Joint Airport Weather Studies project. (Photograph
courtesy of John McCarthy, ©1982 National Center for Atmospheric
Research/National Science Foundation)
Figure 3b.
Typical appearance of a microburst on Doppler radar as observed
during the Joint Airport Weather Studies project. (Photograph
courtesy of John McCarthy, ©1982 National Center for Atmospheric
Research/National Science Foundation)
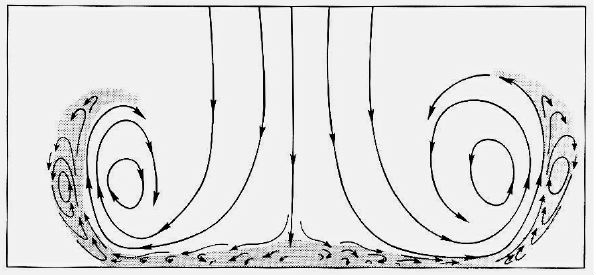 Figure 4.
Cross section of a conceptual vortex ring model of a microburst
(Caracena 1982; 1987). The shaded portion is the friction boundary
layer that contains vorticity opposite to that of the descending
ring.
Figure 4.
Cross section of a conceptual vortex ring model of a microburst
(Caracena 1982; 1987). The shaded portion is the friction boundary
layer that contains vorticity opposite to that of the descending
ring.
 Figure 5.
Numerical simulation of a wet microburst by Droegemeier, showing part
of the distribution of rainwater mixing ratio shaded in increments of
0.007 g per kg (maximum simulated value was 0.119 g per kg) and
streamlines depicting the circulation.
Figure 5.
Numerical simulation of a wet microburst by Droegemeier, showing part
of the distribution of rainwater mixing ratio shaded in increments of
0.007 g per kg (maximum simulated value was 0.119 g per kg) and
streamlines depicting the circulation.
Figure 6. A microburst-bearing rainstorm that moved over the northern portion of Stapleton International Airport (Denver, Colorado) on 7 August 1977; the picture was taken minutes after a plane crash. The crashed aircraft and dust mixed with smoke are visible to the left of the rain shaft (left center). The upward curl of the microburst is visible on the right of the rain shaft and has ascended several kilometers toward the base of the cumulonimbus. Dust clouds widen the base of the rain shaft, indicating that the rain shaft is the source of outwardly driving surface winds. Note that dust and smoke are visible blowing toward the left, opposite to the motion of the upward curl on the right.
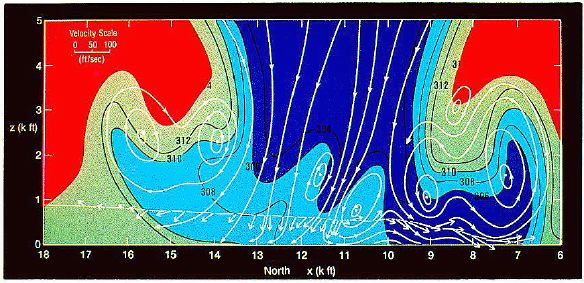 Figure 7. A
vertical cross section through the microburst involved in the 2
August 1985 airplane crash at Dallas-Fort Worth International
Airport, constructed from the digital flight recorder data and based
on the conceptual model (Fig. 4). Potential temperature (kelvins) is
contoured and color coded. Dark blue represents the coldest
temperatures; red represents the warmest. Wind data are represented
by vector (scale at upper left) along the flight track. General
vortex circulation is indicated by the streamlines. Fujita (1986)
produced a similar analysis. (From Caracena et al. 1986)
Figure 7. A
vertical cross section through the microburst involved in the 2
August 1985 airplane crash at Dallas-Fort Worth International
Airport, constructed from the digital flight recorder data and based
on the conceptual model (Fig. 4). Potential temperature (kelvins) is
contoured and color coded. Dark blue represents the coldest
temperatures; red represents the warmest. Wind data are represented
by vector (scale at upper left) along the flight track. General
vortex circulation is indicated by the streamlines. Fujita (1986)
produced a similar analysis. (From Caracena et al. 1986)
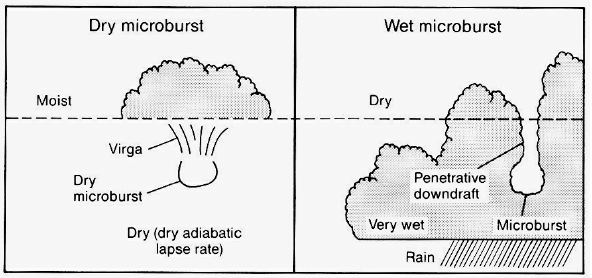 Figure 8.
Conceptual models of environmental opposite extremes associated with
microbursts. (Left) The dry extreme is characteristic of semi-arid
regions of the West, where rain showers virtually evaporate before
reaching the surface, but nevertheless produce destructive winds.
(Right) The wet extreme is characterized by a dry source layer that
ejects pockets of dry air into underlying rain-filled and saturated
air, producing the evaporation that can result in a microburst. Note
that the two panels are not to scale regarding cloud tops, which
extend no higher than 7 km (23,000 ft) AGL in dry microburst storms
and as high as 15 km (49,000 ft) AGL in wet microburst storms.
Figure 8.
Conceptual models of environmental opposite extremes associated with
microbursts. (Left) The dry extreme is characteristic of semi-arid
regions of the West, where rain showers virtually evaporate before
reaching the surface, but nevertheless produce destructive winds.
(Right) The wet extreme is characterized by a dry source layer that
ejects pockets of dry air into underlying rain-filled and saturated
air, producing the evaporation that can result in a microburst. Note
that the two panels are not to scale regarding cloud tops, which
extend no higher than 7 km (23,000 ft) AGL in dry microburst storms
and as high as 15 km (49,000 ft) AGL in wet microburst storms.
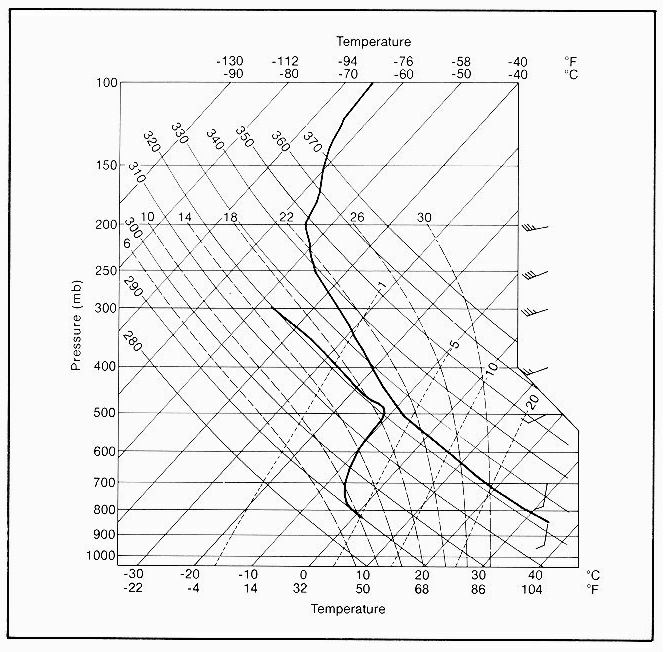 Figure 9a.
A composite of five afternoon (0000 UTC) soundings by Brown et al.
(1982) for convective events that produced damaging surface winds
associated with high-based cumulonimbi in the Front Range area of
Colorado. The temperature is represented by the curve on the right,
and the dew point temperature by the curve on the left. The sounding
is also typical of the type of environment found, during JAWS, to be
associated with large numbers of microbursts (Caracena and Flueck
1988). The sounding shows the characteristic deep, dry mixed layer
with dry adiabatic lapse rate, of ~9.8oC km-1
(~5.4oF per 1000 ft) topped by a moist, cloud-bearing
layer (low dew point depression).
Figure 9a.
A composite of five afternoon (0000 UTC) soundings by Brown et al.
(1982) for convective events that produced damaging surface winds
associated with high-based cumulonimbi in the Front Range area of
Colorado. The temperature is represented by the curve on the right,
and the dew point temperature by the curve on the left. The sounding
is also typical of the type of environment found, during JAWS, to be
associated with large numbers of microbursts (Caracena and Flueck
1988). The sounding shows the characteristic deep, dry mixed layer
with dry adiabatic lapse rate, of ~9.8oC km-1
(~5.4oF per 1000 ft) topped by a moist, cloud-bearing
layer (low dew point depression).
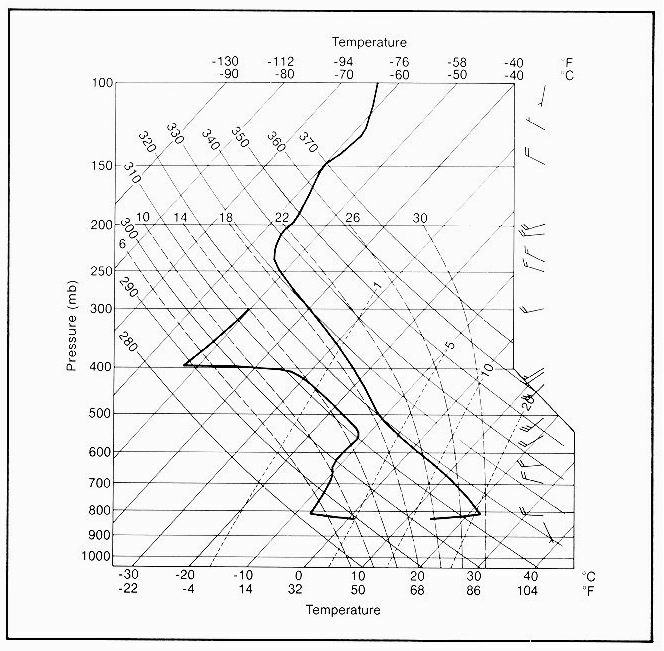 Figure 9b.
A dry microburst sounding, as in Fig. 9a, but taken in the morning
(1200 UTC) of 31 May 1984, showing the kind of shallow inversion near
the surface that usually disappears later in the day to produce a
sounding like Fig. 9a, thereby implying a high potential for dry
microbursts later in the day. This sounding was taken about 7 hours
before a microburst-related near-accident at Stapleton International
Airport.
Figure 9b.
A dry microburst sounding, as in Fig. 9a, but taken in the morning
(1200 UTC) of 31 May 1984, showing the kind of shallow inversion near
the surface that usually disappears later in the day to produce a
sounding like Fig. 9a, thereby implying a high potential for dry
microbursts later in the day. This sounding was taken about 7 hours
before a microburst-related near-accident at Stapleton International
Airport.
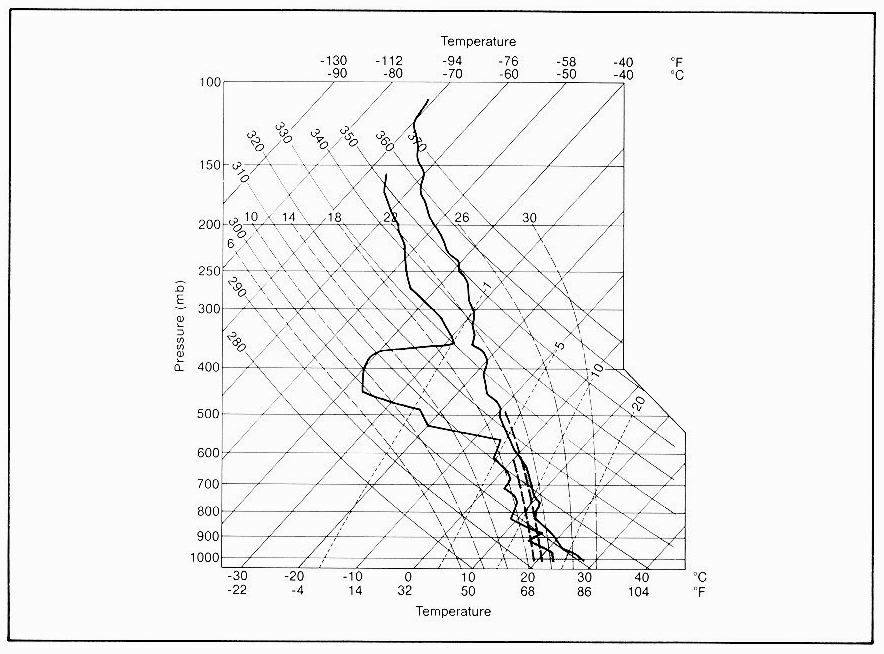 Figure 10.
A typical wet microburst sounding taken at 1500 UTC, 1 July 1975,
just south of Lake Okeechobee at the Field Observing Site of the
Florida Area Cumulus Experiment just 3 hours before a microburst
embedded in a gush of heavy rain struck the very same site. Note the
elevated dry layer centered at about 400 mb that could act as a
source of the potentially cool downdraft described in Fig. 7. The
right-hand heavy dashed line represents a hypothetical downdraft that
produces a maximum wind speed of 22 m s-1 (43 kt); the
left-hand heavy dashed line represents a downdraft colder by
1oC (1.8oF) that produces a maximum wind gust
of 31 m s-1 (60 kt). (From Caracena and Maier, 1987)
Figure 10.
A typical wet microburst sounding taken at 1500 UTC, 1 July 1975,
just south of Lake Okeechobee at the Field Observing Site of the
Florida Area Cumulus Experiment just 3 hours before a microburst
embedded in a gush of heavy rain struck the very same site. Note the
elevated dry layer centered at about 400 mb that could act as a
source of the potentially cool downdraft described in Fig. 7. The
right-hand heavy dashed line represents a hypothetical downdraft that
produces a maximum wind speed of 22 m s-1 (43 kt); the
left-hand heavy dashed line represents a downdraft colder by
1oC (1.8oF) that produces a maximum wind gust
of 31 m s-1 (60 kt). (From Caracena and Maier, 1987)
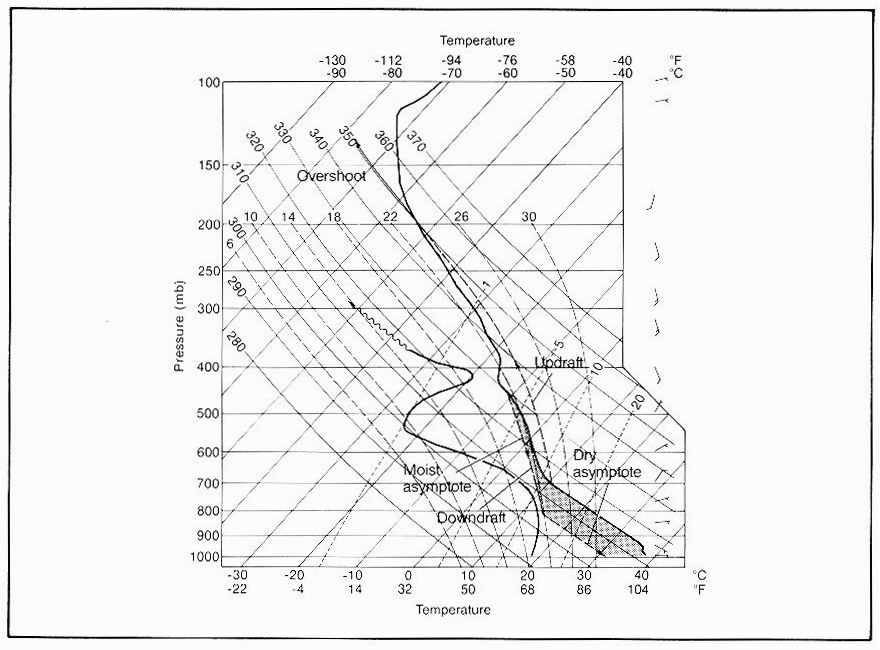 Figure 11.
Reconstructed sounding for Dallas-Fort Worth International Airport
for a time when a microburst-related accident happened. This sounding
shows the characteristics of a dry microburst environment as
described in Fig. 7, but with abundant precipitable water because of
the lower elevation of the site. The high microburst potential is
indicated here by a rather deep mixed layer about 3 km (10,000 ft), a
moist cloud-bearing layer at 700 mb, and a dry layer at about 500 mb.
The area shaded light gray represents positive buoyancy in the
updraft. The area shaded dark gray represents negative buoyancy in
the downdraft, which corresponds to an estimated maximum wind gust of
35 m s-1 (68 kt).
Figure 11.
Reconstructed sounding for Dallas-Fort Worth International Airport
for a time when a microburst-related accident happened. This sounding
shows the characteristics of a dry microburst environment as
described in Fig. 7, but with abundant precipitable water because of
the lower elevation of the site. The high microburst potential is
indicated here by a rather deep mixed layer about 3 km (10,000 ft), a
moist cloud-bearing layer at 700 mb, and a dry layer at about 500 mb.
The area shaded light gray represents positive buoyancy in the
updraft. The area shaded dark gray represents negative buoyancy in
the downdraft, which corresponds to an estimated maximum wind gust of
35 m s-1 (68 kt).
Figure 12. A typical high-based thunderstorm that can produce downbursts, but little or no rain at the surface. The picture was taken on 29 August 1979 at about 1750 MDT, looking east from Boulder County Airport, Colorado. (Photograph ©1980, F. Caracena)
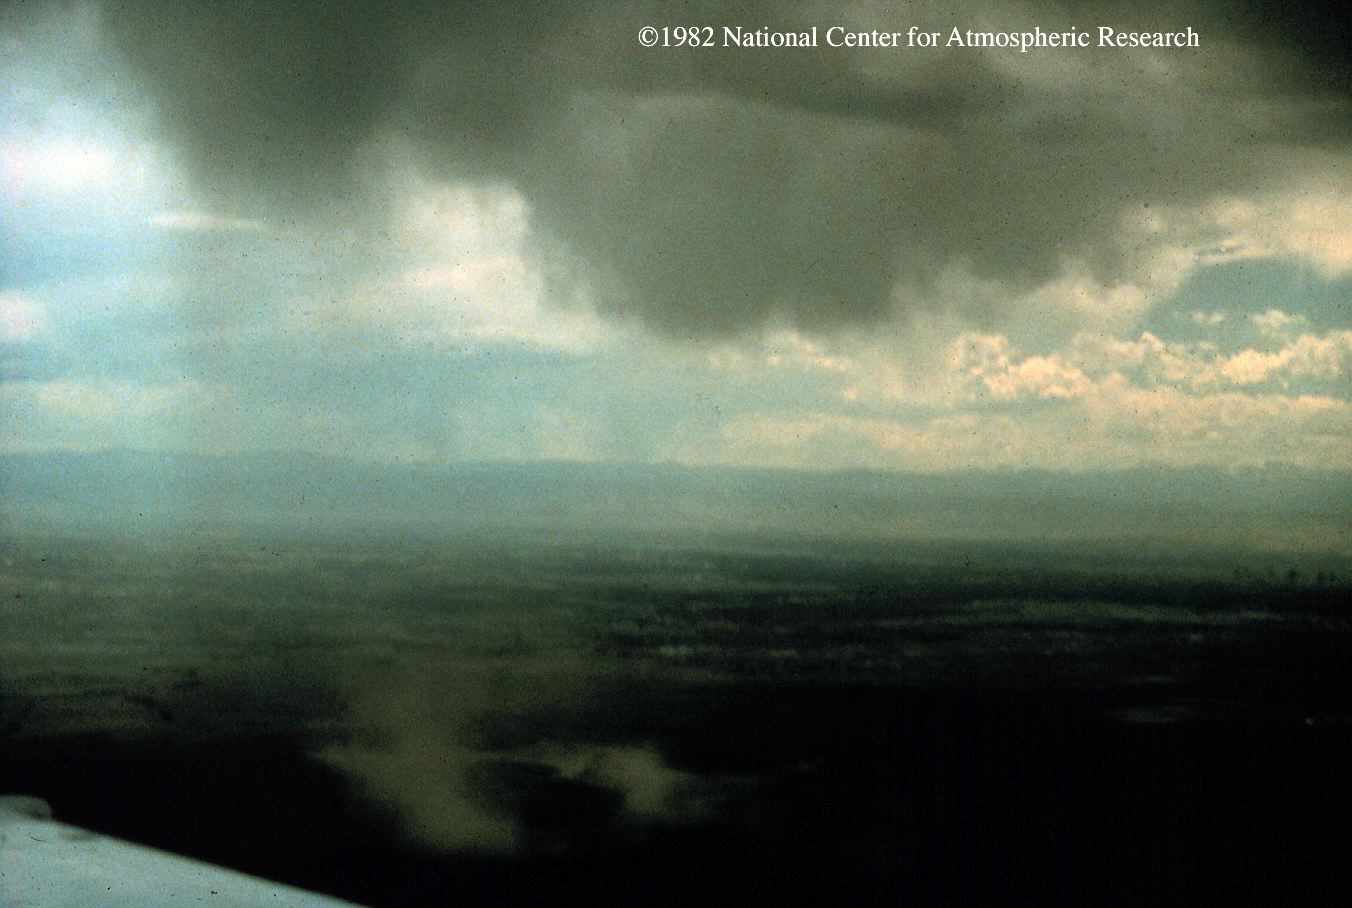 Figure 13.
A dry microburst (small ring of dust, bottom left) just beginning to
form under a prominent virga shaft (top center) extending below the
high base of a cumulonimbus. (Photograph ©1982, National Center
for Atmospheric Research/National Science Foundation; taken by E.
Szoke, 14 July 1982, during JAWS)
Figure 13.
A dry microburst (small ring of dust, bottom left) just beginning to
form under a prominent virga shaft (top center) extending below the
high base of a cumulonimbus. (Photograph ©1982, National Center
for Atmospheric Research/National Science Foundation; taken by E.
Szoke, 14 July 1982, during JAWS)
 Figure 14.
The dry microburst pictured in Fig. 13, photographed a few minutes
later when the ring of dust had expanded and developed further.
(Photograph ©1982, National Center for Atmospheric
Research/National Science Foundation; taken by E. Szoke, 14 July
1982, during JAWS)
Figure 14.
The dry microburst pictured in Fig. 13, photographed a few minutes
later when the ring of dust had expanded and developed further.
(Photograph ©1982, National Center for Atmospheric
Research/National Science Foundation; taken by E. Szoke, 14 July
1982, during JAWS)
Figure 15. A close-up of a ring of dust associated with a dry microburst photographed 27 km (15 n mi) east of Stapleton International Airport on 14 July 1982 during JAWS. (Photograph ©1985, T. Fujita)
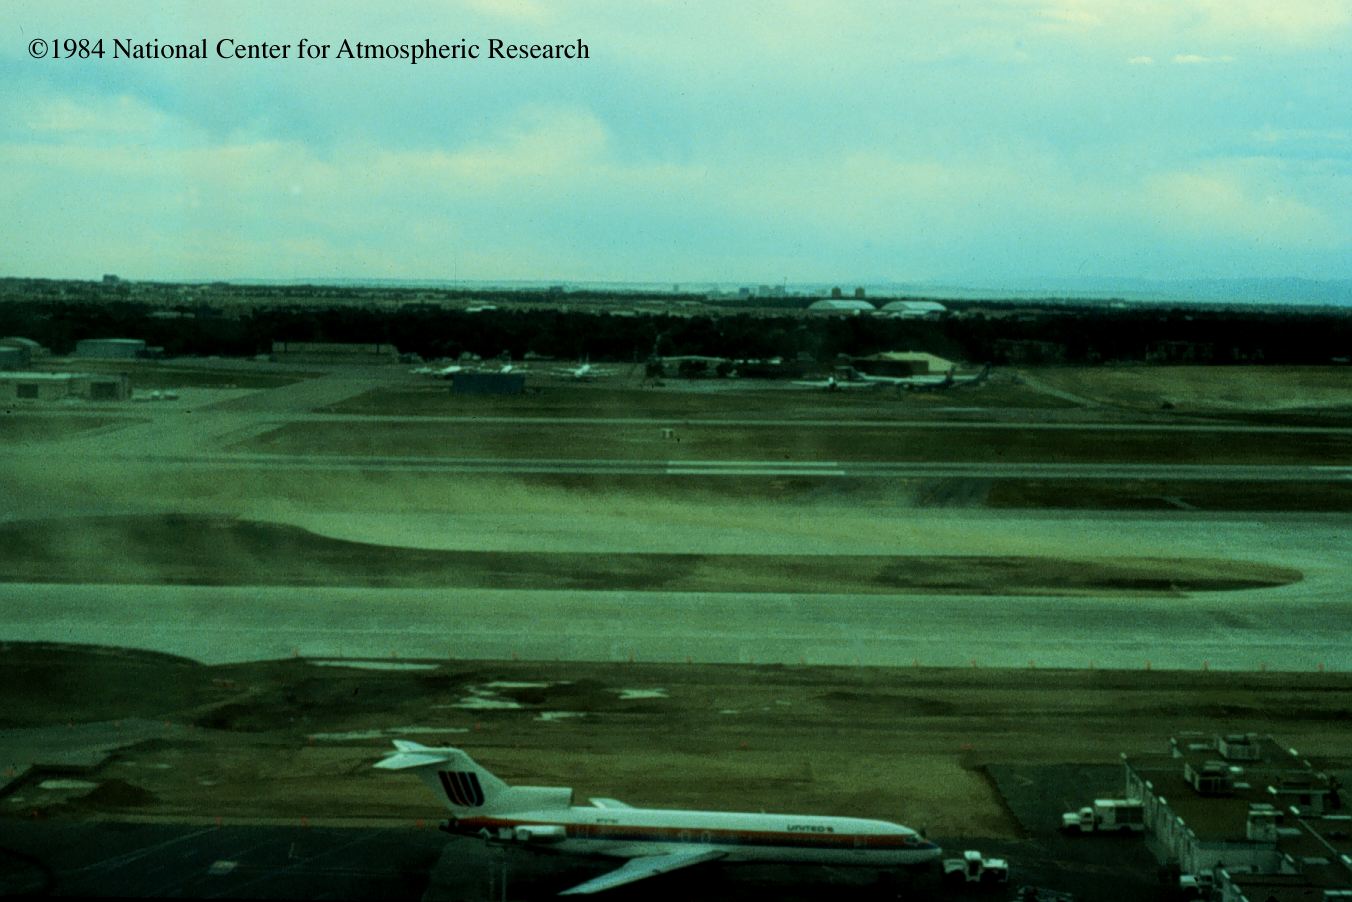 Figure 16.
Part of dry microburst, photographed at close range from the
Denver-Stapleton Control Tower, in the summer of 1984. (Photograph
©1984, National Center for Atmospheric Research/National Science
Foundation; taken by W. Schreiber)
Figure 16.
Part of dry microburst, photographed at close range from the
Denver-Stapleton Control Tower, in the summer of 1984. (Photograph
©1984, National Center for Atmospheric Research/National Science
Foundation; taken by W. Schreiber)
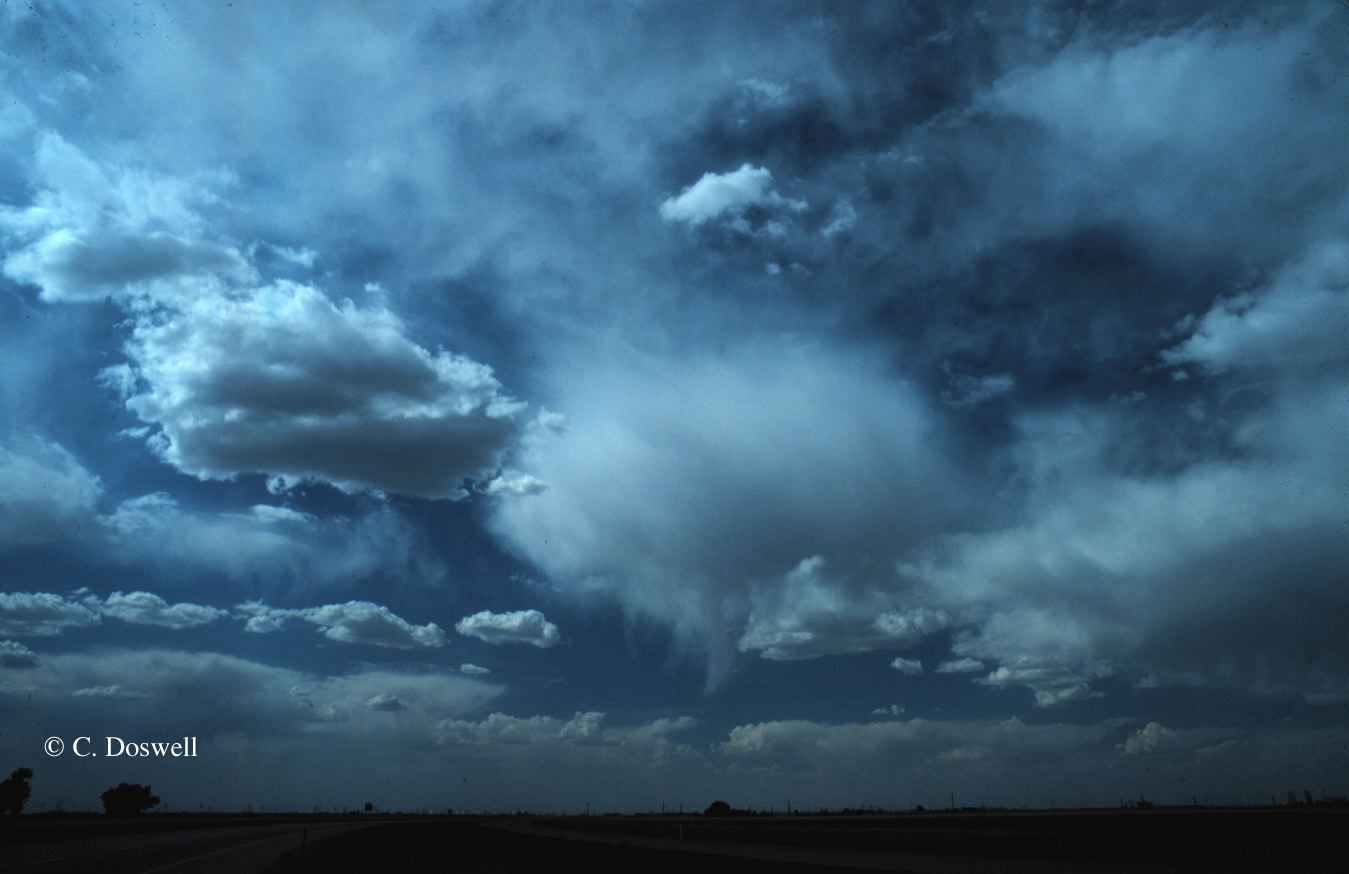 Figure 17a.
A fair-weather-appearing sky in which dry microbursts later
developed, near Abernathy, Texas, on 21 May 1986. The only clue to
potential microburst development is the combination of a fibrous
appearance of the clouds and incipient virga shafts of some of the
clouds. (Photograph ©1986,
C.A. Doswell III)
Figure 17a.
A fair-weather-appearing sky in which dry microbursts later
developed, near Abernathy, Texas, on 21 May 1986. The only clue to
potential microburst development is the combination of a fibrous
appearance of the clouds and incipient virga shafts of some of the
clouds. (Photograph ©1986,
C.A. Doswell III)
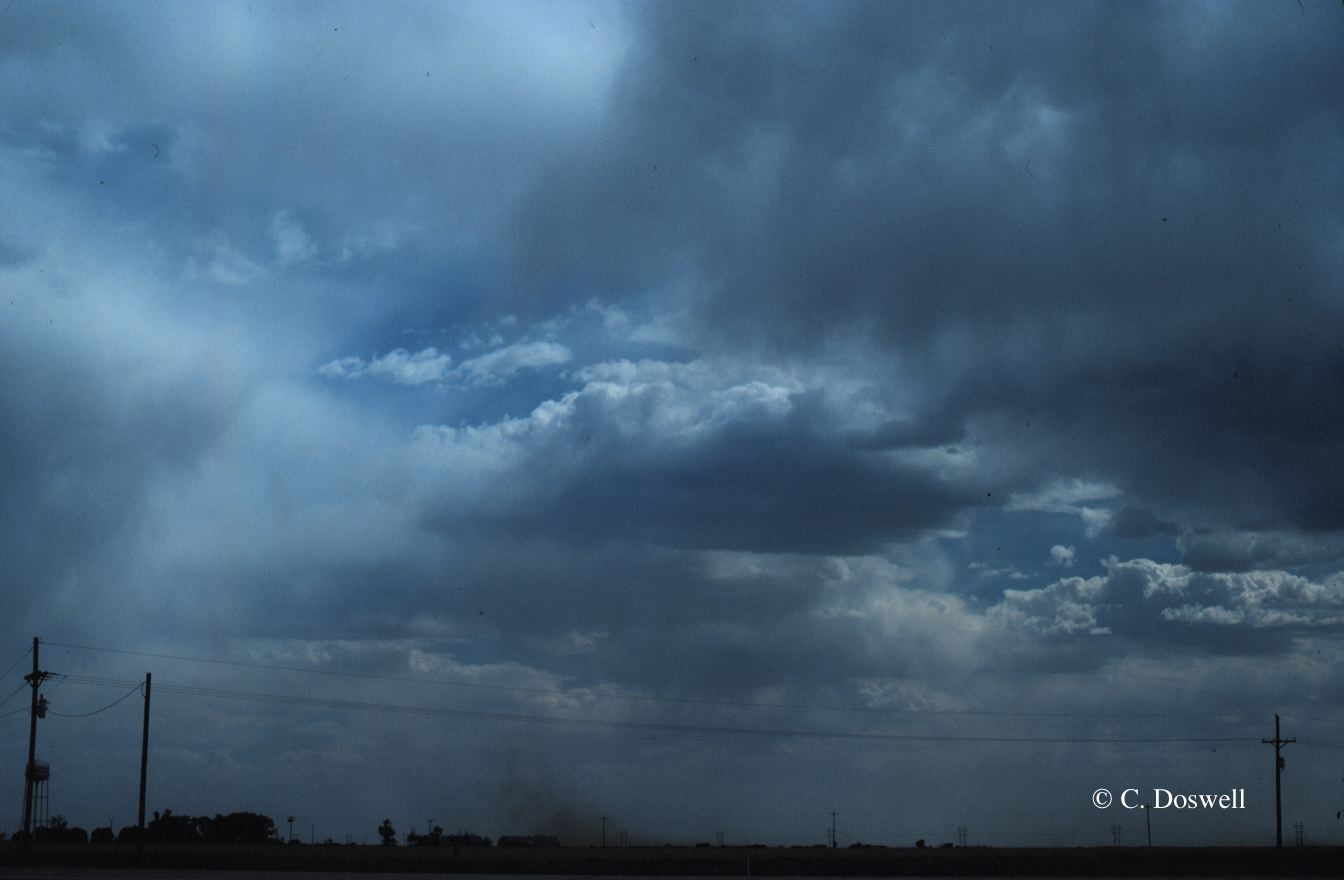 Figure 17b.
A dry microburst rendered visible by blowing dust in the general area
shown in Fig. 17a, about 20 minutes later. (Photograph ©1986,
C.A. Doswell III)
Figure 17b.
A dry microburst rendered visible by blowing dust in the general area
shown in Fig. 17a, about 20 minutes later. (Photograph ©1986,
C.A. Doswell III)
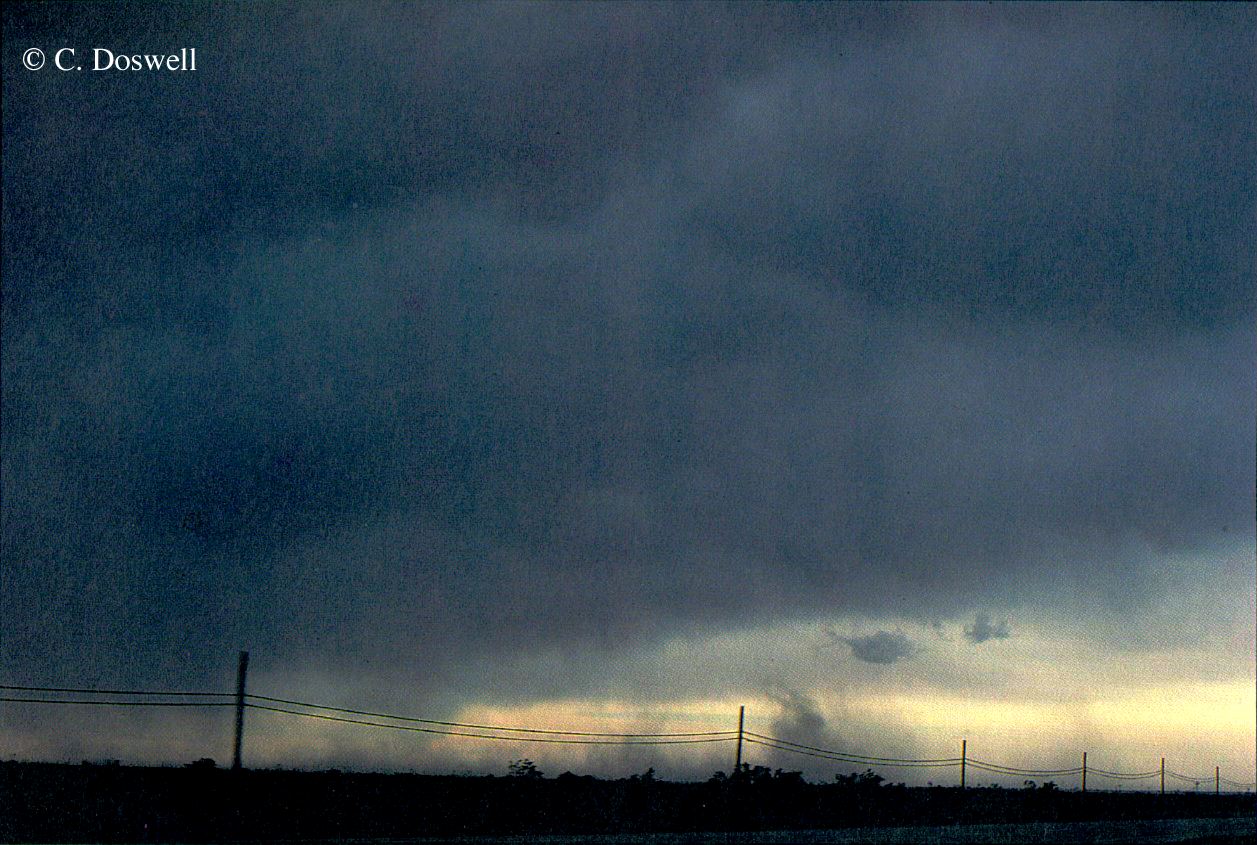 Figure 18.
Downbursts forming under a large thunderstorm anvil west of Hobbs, N.
Mex., May 1986. The downbursts are far from the parent updraft
(off-camera) that produced hail. (Photograph ©1986, C.A. Doswell
III)
Figure 18.
Downbursts forming under a large thunderstorm anvil west of Hobbs, N.
Mex., May 1986. The downbursts are far from the parent updraft
(off-camera) that produced hail. (Photograph ©1986, C.A. Doswell
III)
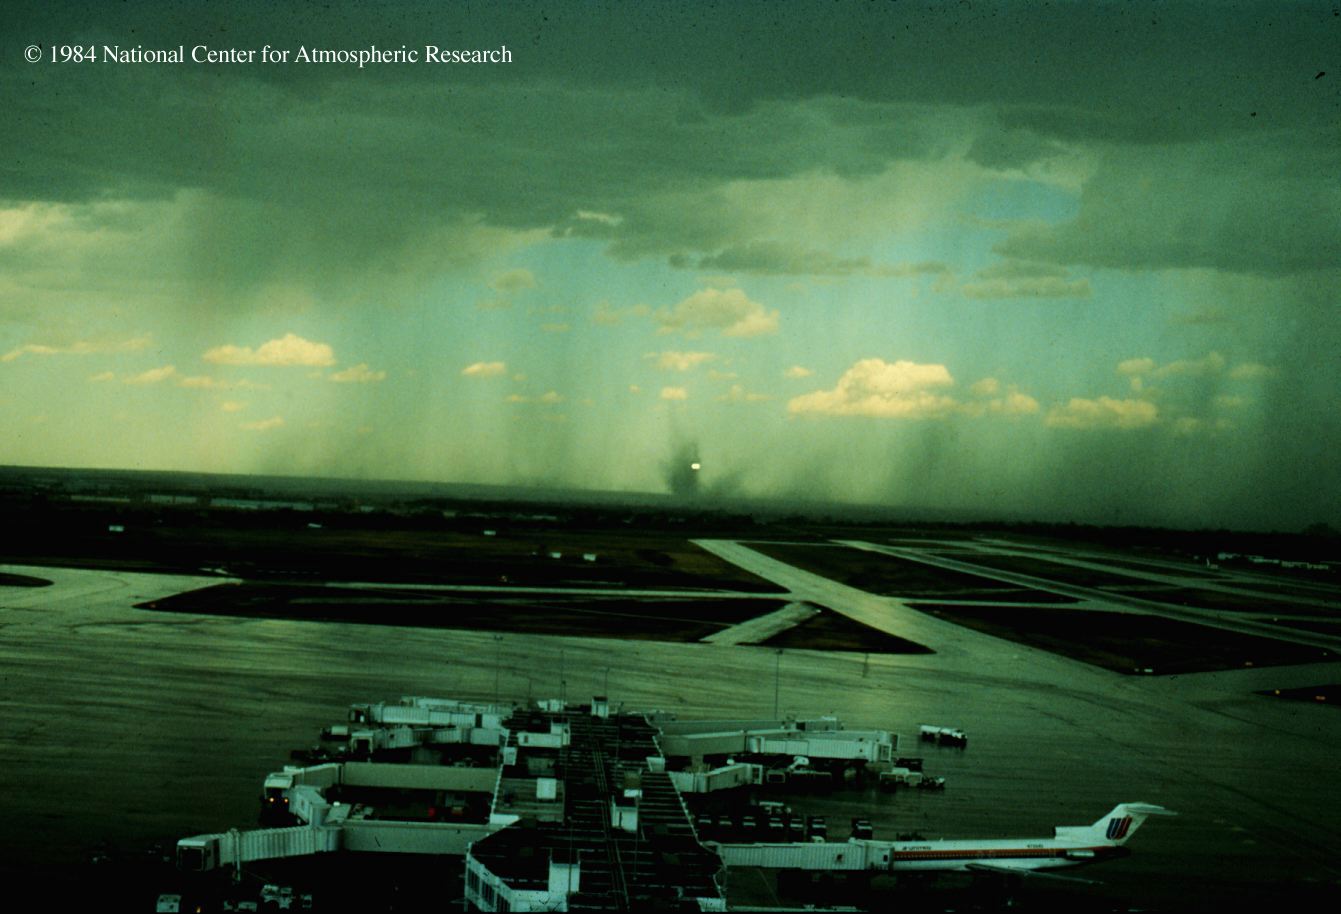 Figure 19.
A gust front vortex of tornadic strength (gustnado) and blowing dust
spawned by a high-based storm along the landing approach to Denver's
Stapleton International Airport, 1984. The light from an aircraft
attempting to land is visible through the gustnado. (Photograph
©1984, National Center for Atmospheric Research/National Science
Foundation; taken by W. Schreiber)
Figure 19.
A gust front vortex of tornadic strength (gustnado) and blowing dust
spawned by a high-based storm along the landing approach to Denver's
Stapleton International Airport, 1984. The light from an aircraft
attempting to land is visible through the gustnado. (Photograph
©1984, National Center for Atmospheric Research/National Science
Foundation; taken by W. Schreiber)
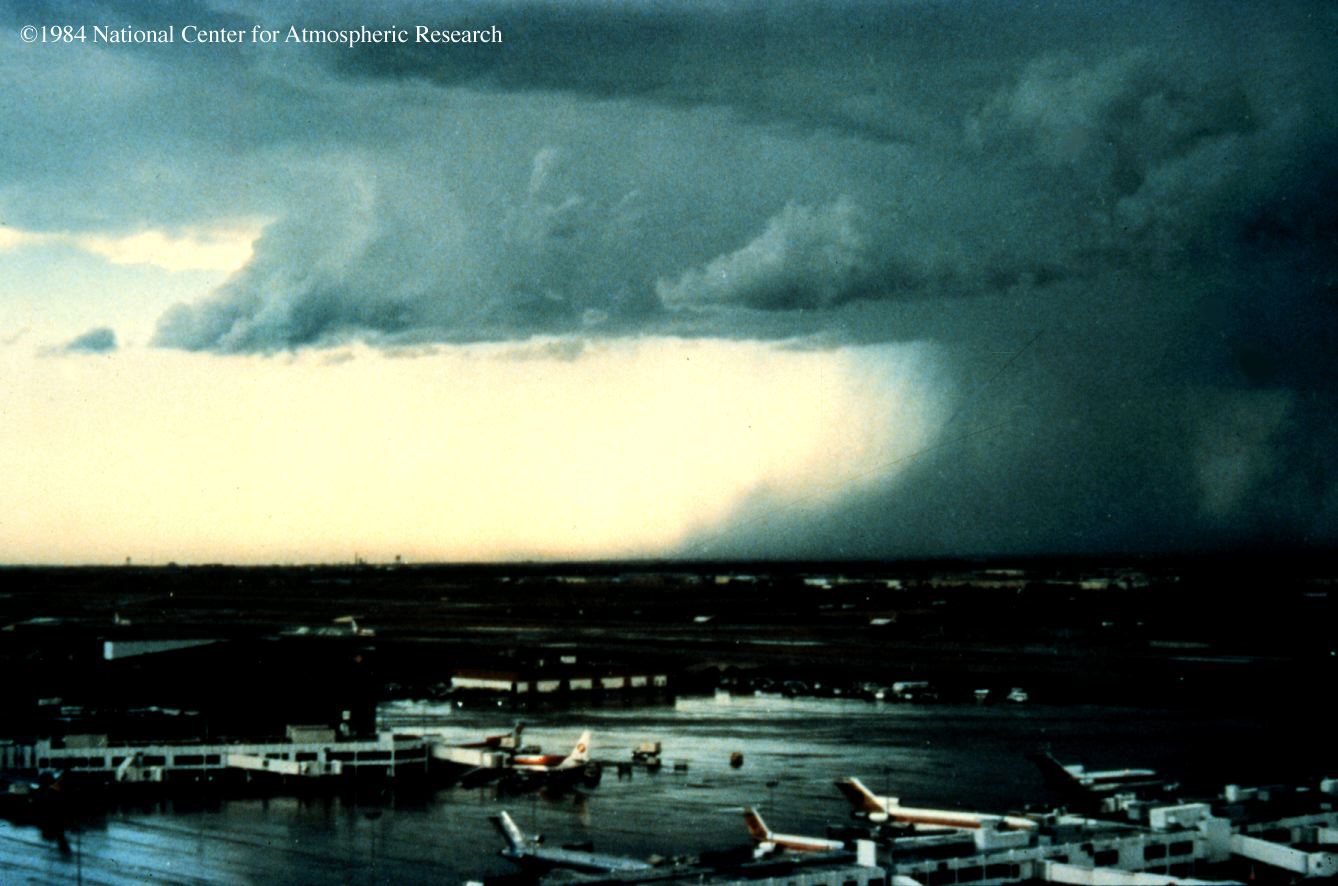 Figure 20.
A high-based thunderstorm near Stapleton International Airport during
the CLAWS project (1984), producing heavy rain at the surface with a
characteristic foot-shaped bulge between cloud base and the surface
(right of center) extending outward from the center of the rainshaft.
The bulge marks strong horizontal winds characteristic of a
microburst that carry precipitation outward from the impact center of
the downdraft. (Photograph ©1984, National Center for
Atmospheric Research/National Science Foundation; taken by W.
Schreiber)
Figure 20.
A high-based thunderstorm near Stapleton International Airport during
the CLAWS project (1984), producing heavy rain at the surface with a
characteristic foot-shaped bulge between cloud base and the surface
(right of center) extending outward from the center of the rainshaft.
The bulge marks strong horizontal winds characteristic of a
microburst that carry precipitation outward from the impact center of
the downdraft. (Photograph ©1984, National Center for
Atmospheric Research/National Science Foundation; taken by W.
Schreiber)
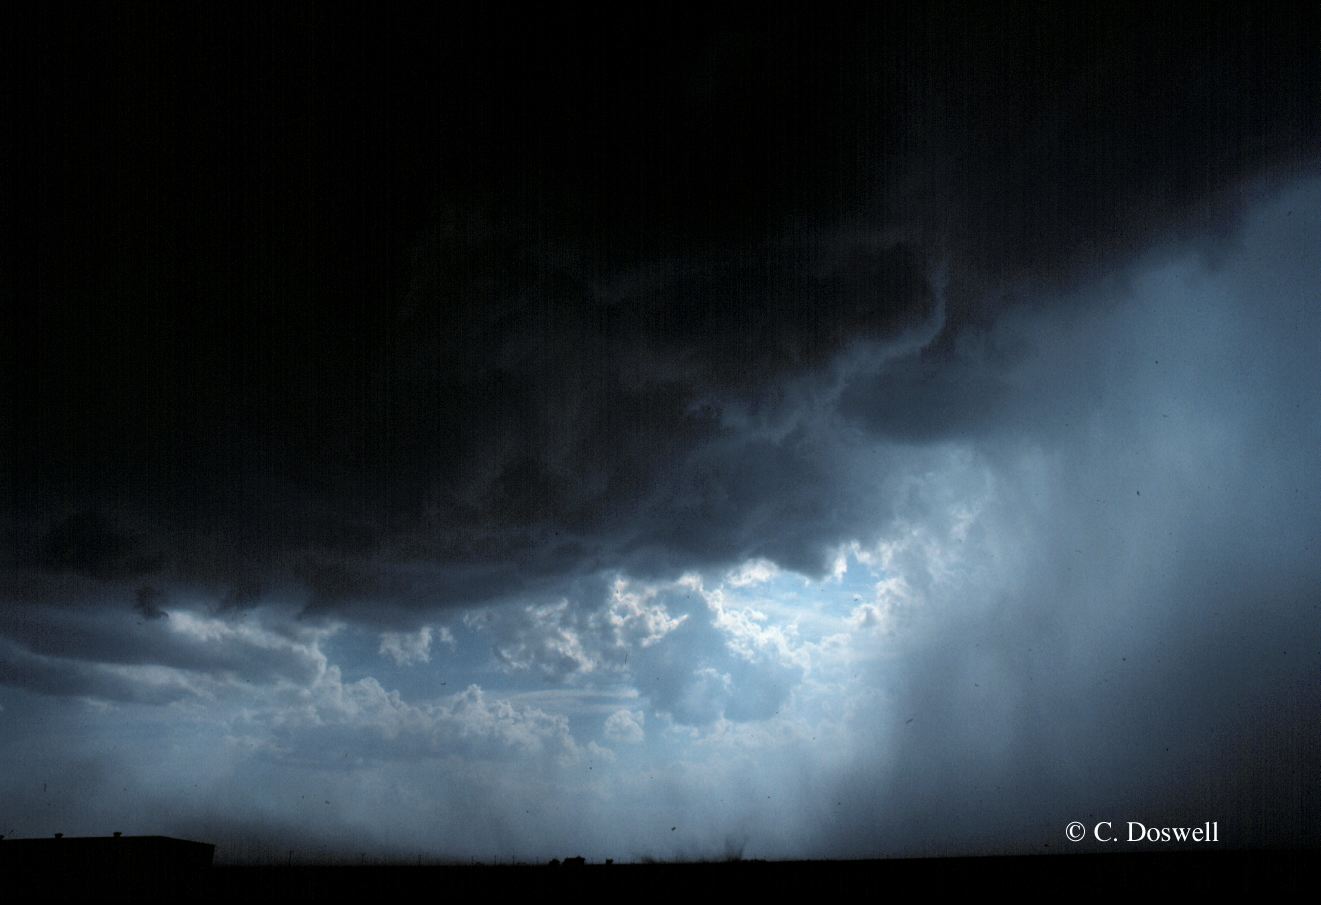 Figure 21a.
A wet microburst embedded in heavy rain in western Texas, 1 June
1985. Strong horizontal winds drive rain near the ground well beyond
the edge of the rain shaft (on the right side of photograph). Note
the plume of dust (center bottom) beginning to curl up from a plowed
field. (Photograph ©1985, C.A. Doswell III)
Figure 21a.
A wet microburst embedded in heavy rain in western Texas, 1 June
1985. Strong horizontal winds drive rain near the ground well beyond
the edge of the rain shaft (on the right side of photograph). Note
the plume of dust (center bottom) beginning to curl up from a plowed
field. (Photograph ©1985, C.A. Doswell III)
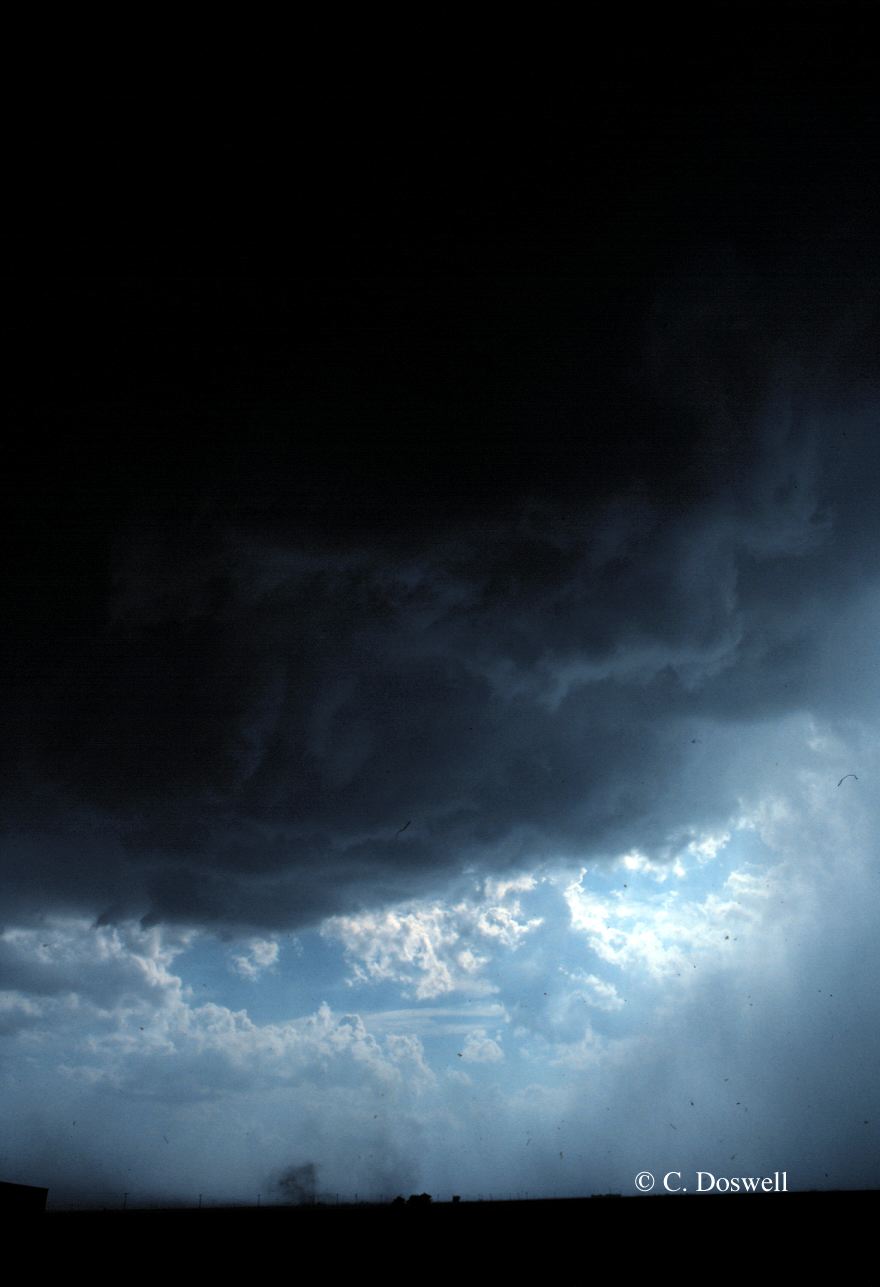 Figure 21b.
The microburst shown in Fig. 21a, a few minutes later. This view
shows the rapid changes in the dust plume, including a weak vortex
along the outflow boundary as a concentrated dust mass (bottom left
center). (Photograph ©1985, C.A. Doswell III)
Figure 21b.
The microburst shown in Fig. 21a, a few minutes later. This view
shows the rapid changes in the dust plume, including a weak vortex
along the outflow boundary as a concentrated dust mass (bottom left
center). (Photograph ©1985, C.A. Doswell III)
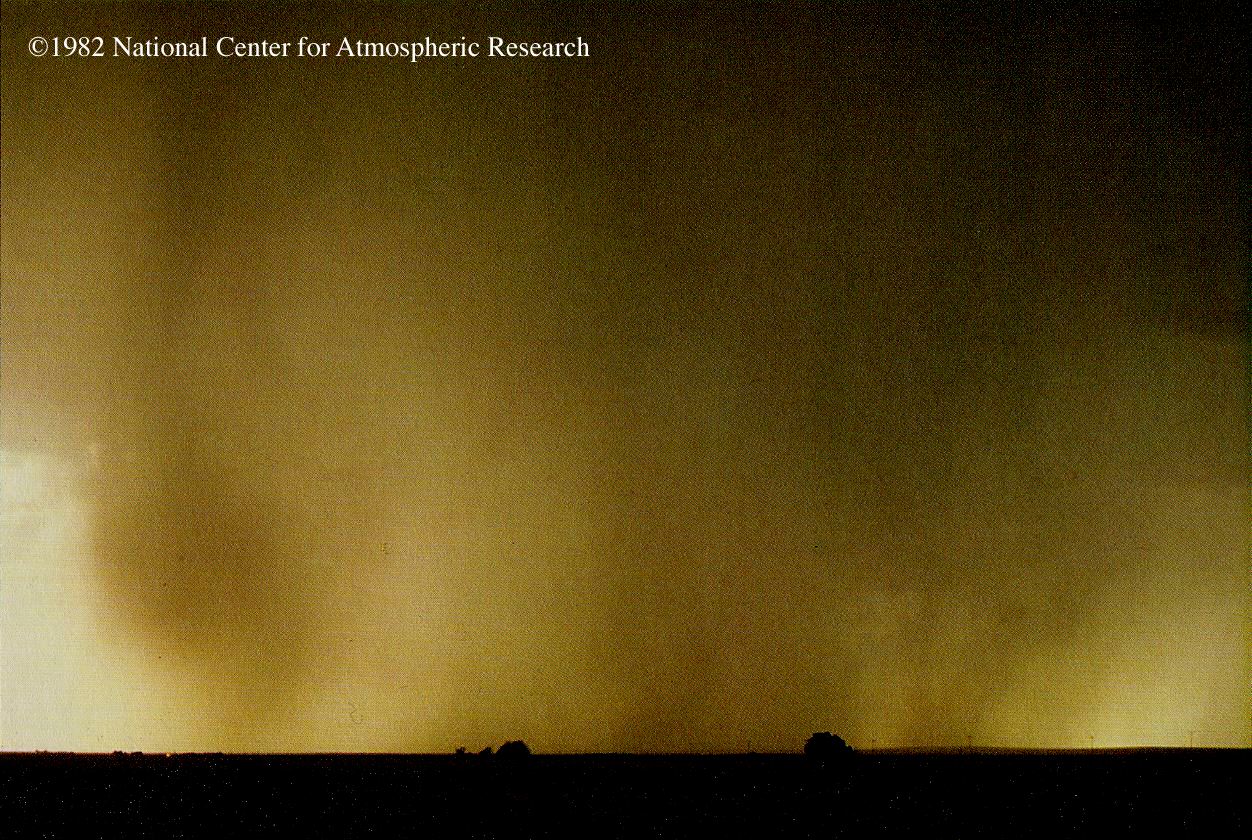 Figure 22a.
A globular mass of heavy rain descending (left) near the edge of a
more extended rain shaft (right). Such a mass bay be the indicator of
a descending microburst. (Photograph ©1982, National Center for
Atmospheric Research/National Science Foundation; taken by E. Szoke
during JAWS)
Figure 22a.
A globular mass of heavy rain descending (left) near the edge of a
more extended rain shaft (right). Such a mass bay be the indicator of
a descending microburst. (Photograph ©1982, National Center for
Atmospheric Research/National Science Foundation; taken by E. Szoke
during JAWS)
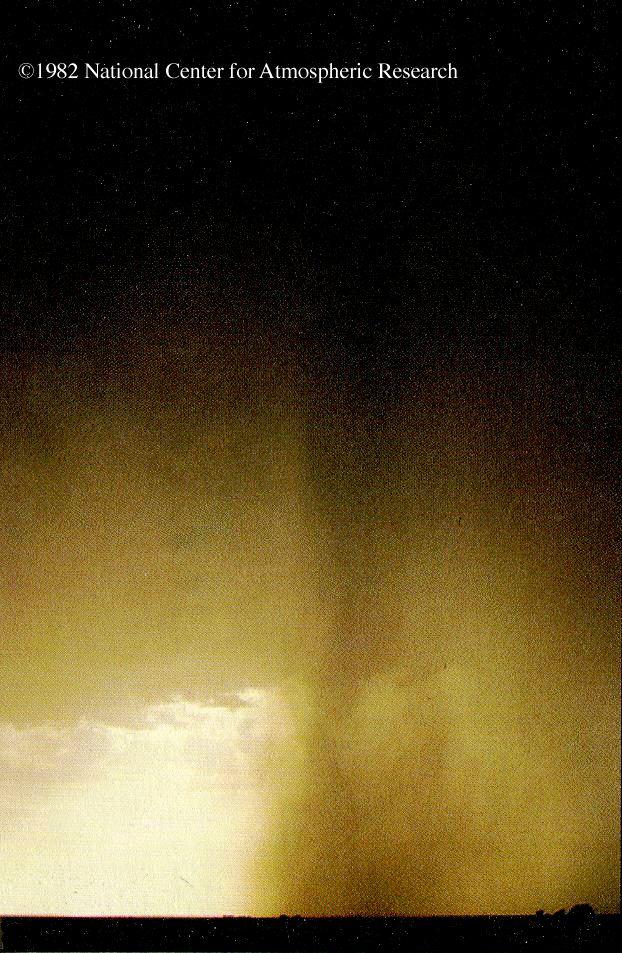 Figure 22b.
The globular mass shown in Fig. 22a, less than a minute later. It is
reaching the surface; a clearing above it is suggestive of a strong
downdraft, further indication of a possible microburst. (Photograph
©1982, National Center for Atmospheric Research/National Science
Foundation; taken by E. Szoke during JAWS)
Figure 22b.
The globular mass shown in Fig. 22a, less than a minute later. It is
reaching the surface; a clearing above it is suggestive of a strong
downdraft, further indication of a possible microburst. (Photograph
©1982, National Center for Atmospheric Research/National Science
Foundation; taken by E. Szoke during JAWS)
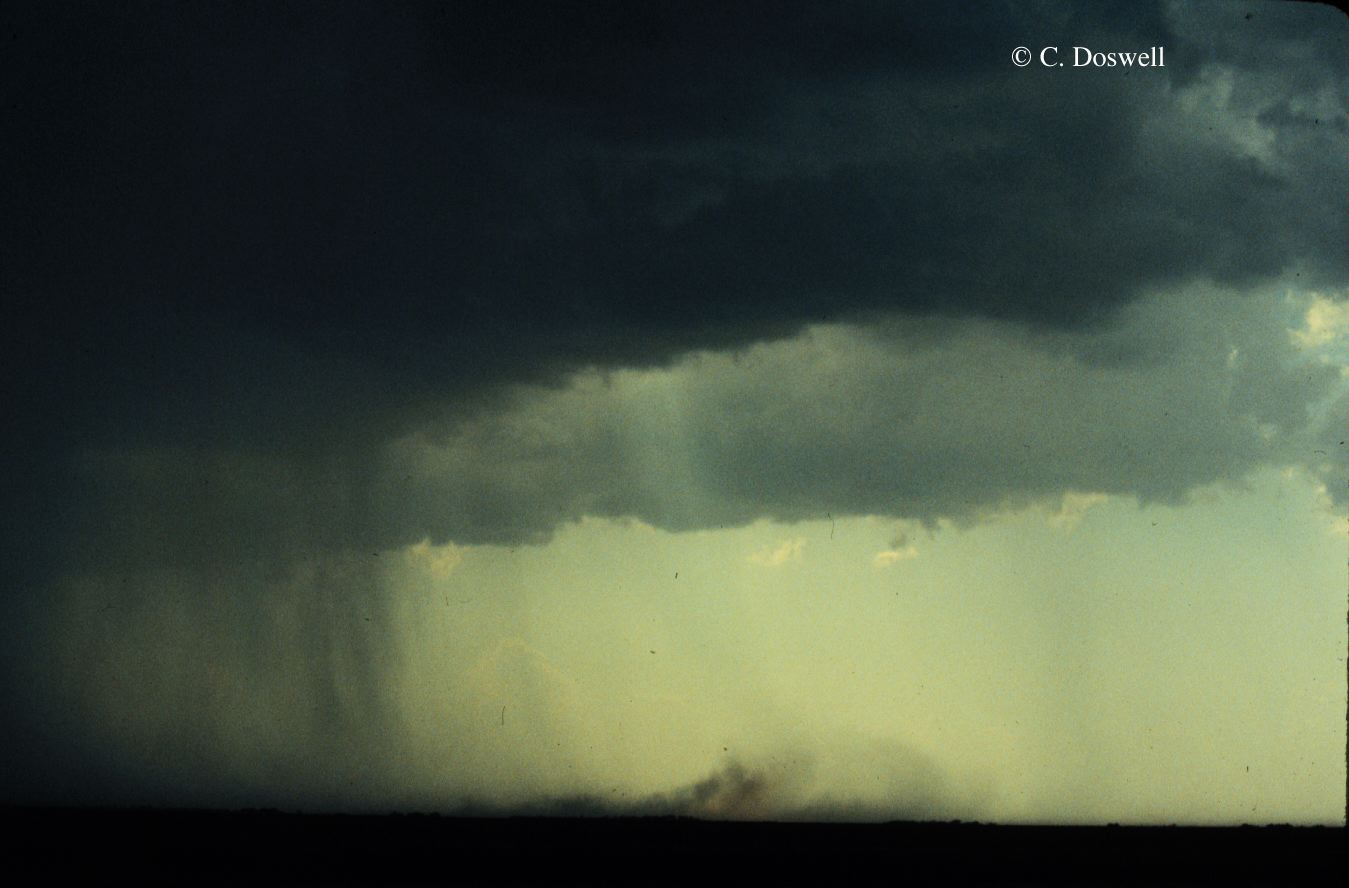 Figure 23a.
A medium-based thunderstorm near Knox City, Texas, 15 May 1986, in
the process of producing a wet microburst. Note the plume of dust
beginning to rise from the surface, to the right of the rain shaft.
(Photograph ©1986, C.A. Doswell III)
Figure 23a.
A medium-based thunderstorm near Knox City, Texas, 15 May 1986, in
the process of producing a wet microburst. Note the plume of dust
beginning to rise from the surface, to the right of the rain shaft.
(Photograph ©1986, C.A. Doswell III)
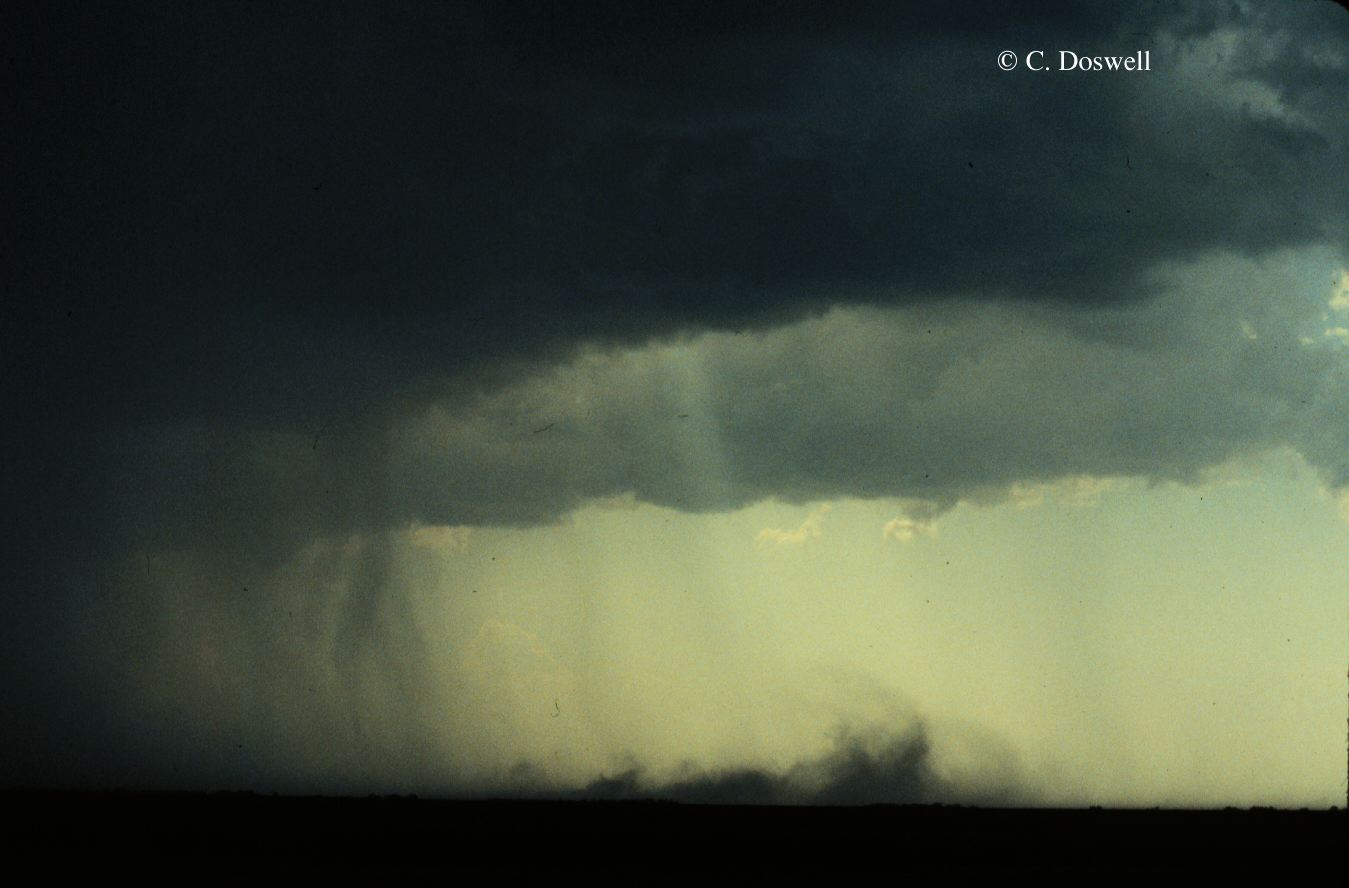 Figure 23b.
The storm shown in Fig. 23a, a few tens of seconds later. The plume
of blowing dust has rapidly expanded. (Photograph ©1986, C.A.
Doswell III)
Figure 23b.
The storm shown in Fig. 23a, a few tens of seconds later. The plume
of blowing dust has rapidly expanded. (Photograph ©1986, C.A.
Doswell III)
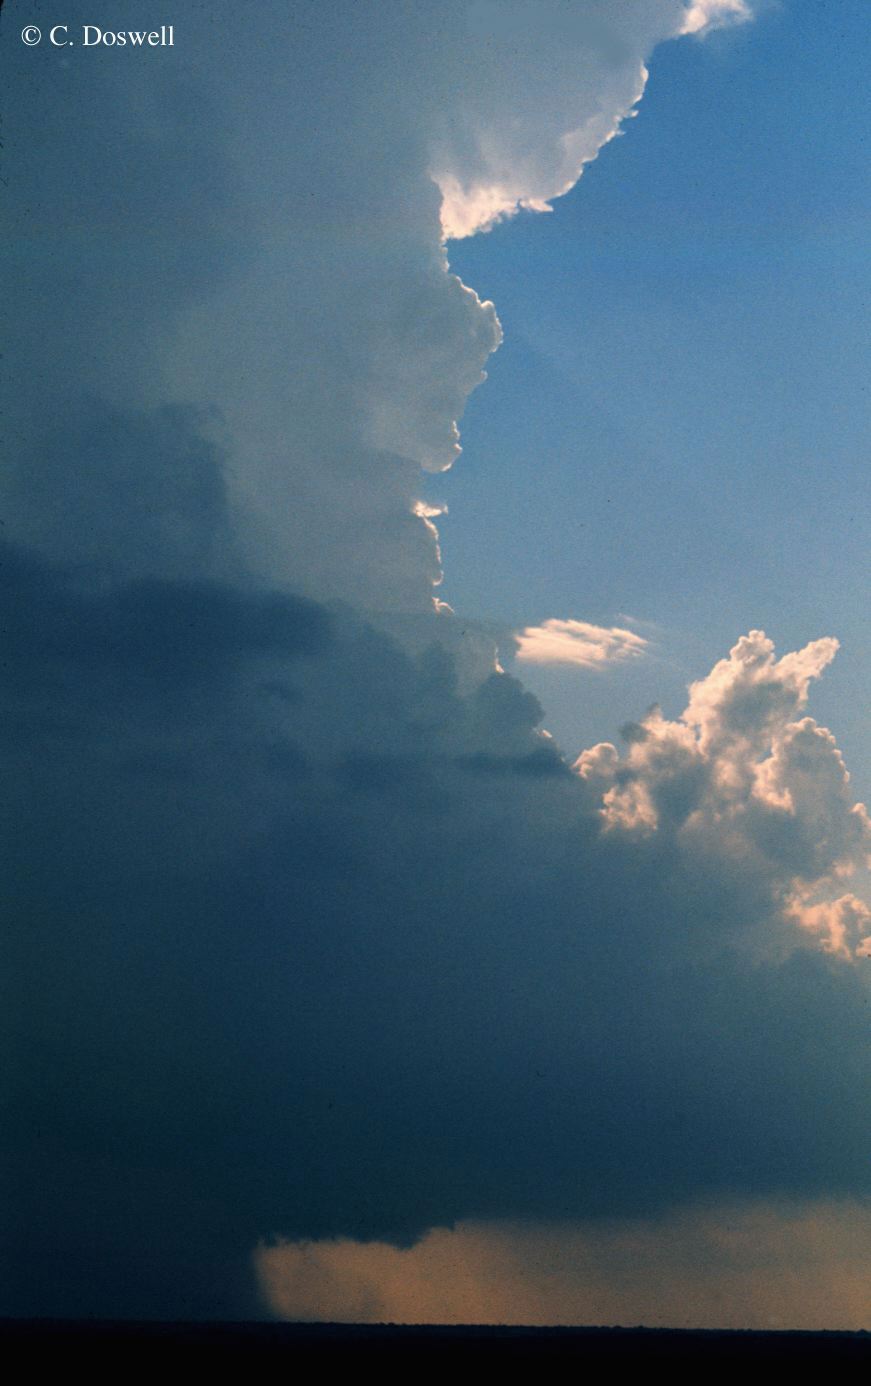 Figure 24.
A tall maturing cumulonimbus cloud southern Oklahoma on 5 May 1976,
showing evidence of strong outflow near the surface in the outward
slope of the rainshaft and the faint suggestion of a precipitation
curl under the lowered updraft base (bottom center), possibly
indicating a microburst. (Photograph ©1976, C.A. Doswell III)
Figure 24.
A tall maturing cumulonimbus cloud southern Oklahoma on 5 May 1976,
showing evidence of strong outflow near the surface in the outward
slope of the rainshaft and the faint suggestion of a precipitation
curl under the lowered updraft base (bottom center), possibly
indicating a microburst. (Photograph ©1976, C.A. Doswell III)
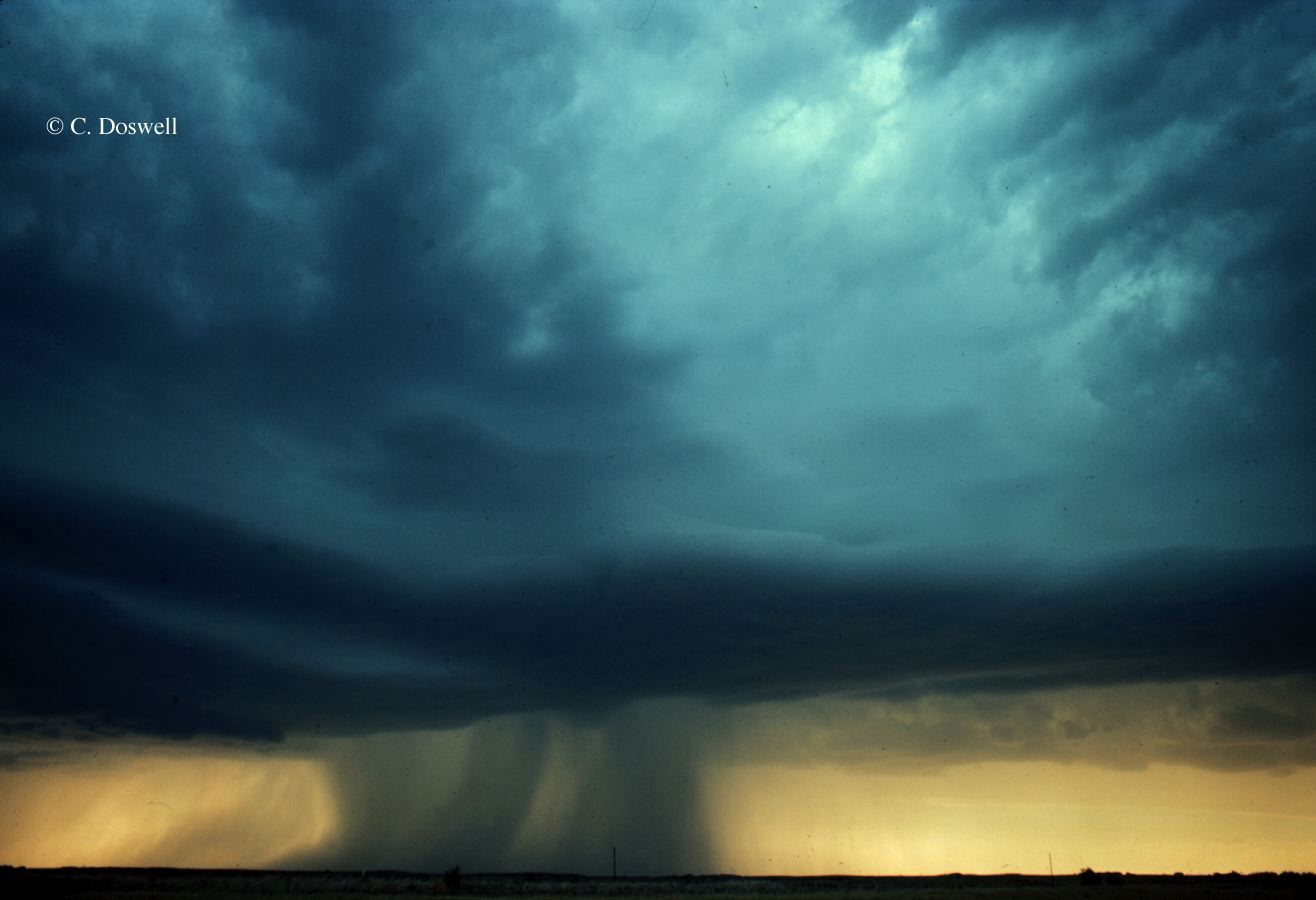 Figure 25.
A wet microburst on 20 May 1974, characterized by a well-defined foot
shape on the left side of the rainshaft. (Photograph ©1974, C.A.
Doswell III)
Figure 25.
A wet microburst on 20 May 1974, characterized by a well-defined foot
shape on the left side of the rainshaft. (Photograph ©1974, C.A.
Doswell III)
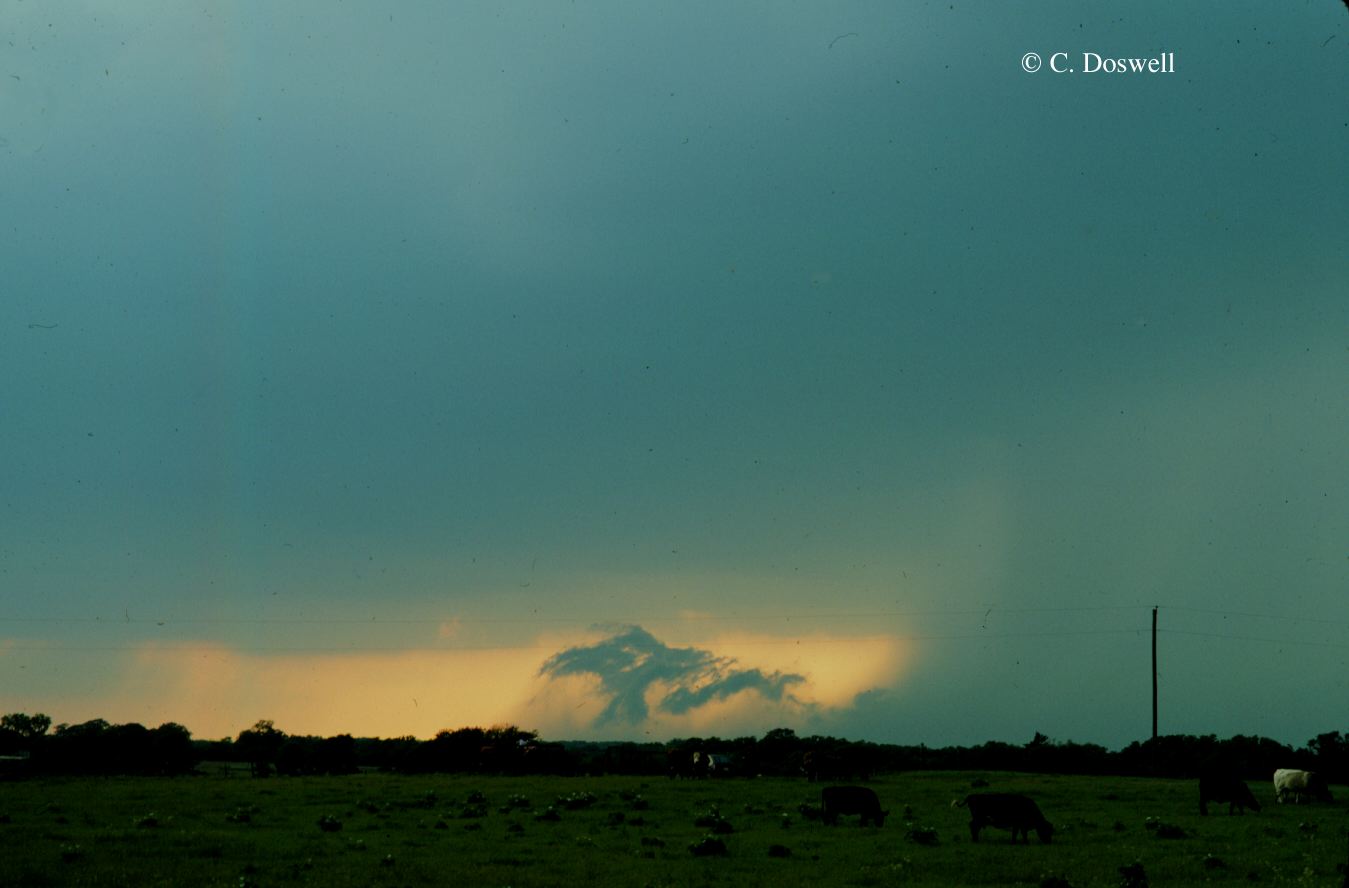 Figure 26.
A wet microburst near Alvord, Texas, 13 May 1986, characterized by
the well-defined foot (right of center) and low-level scud clouds
condensing on the leading edge of the outflow (above the "toe").
(Photograph ©1986, C.A. Doswell III)
Figure 26.
A wet microburst near Alvord, Texas, 13 May 1986, characterized by
the well-defined foot (right of center) and low-level scud clouds
condensing on the leading edge of the outflow (above the "toe").
(Photograph ©1986, C.A. Doswell III)
Figure 27. A group of localized rain shafts in south-central Oklahoma, 23 May 1981. The faint upward curls near the ground (left of center) are suggestive of microbursts. (Photograph ©1981, C.A. Doswell III)
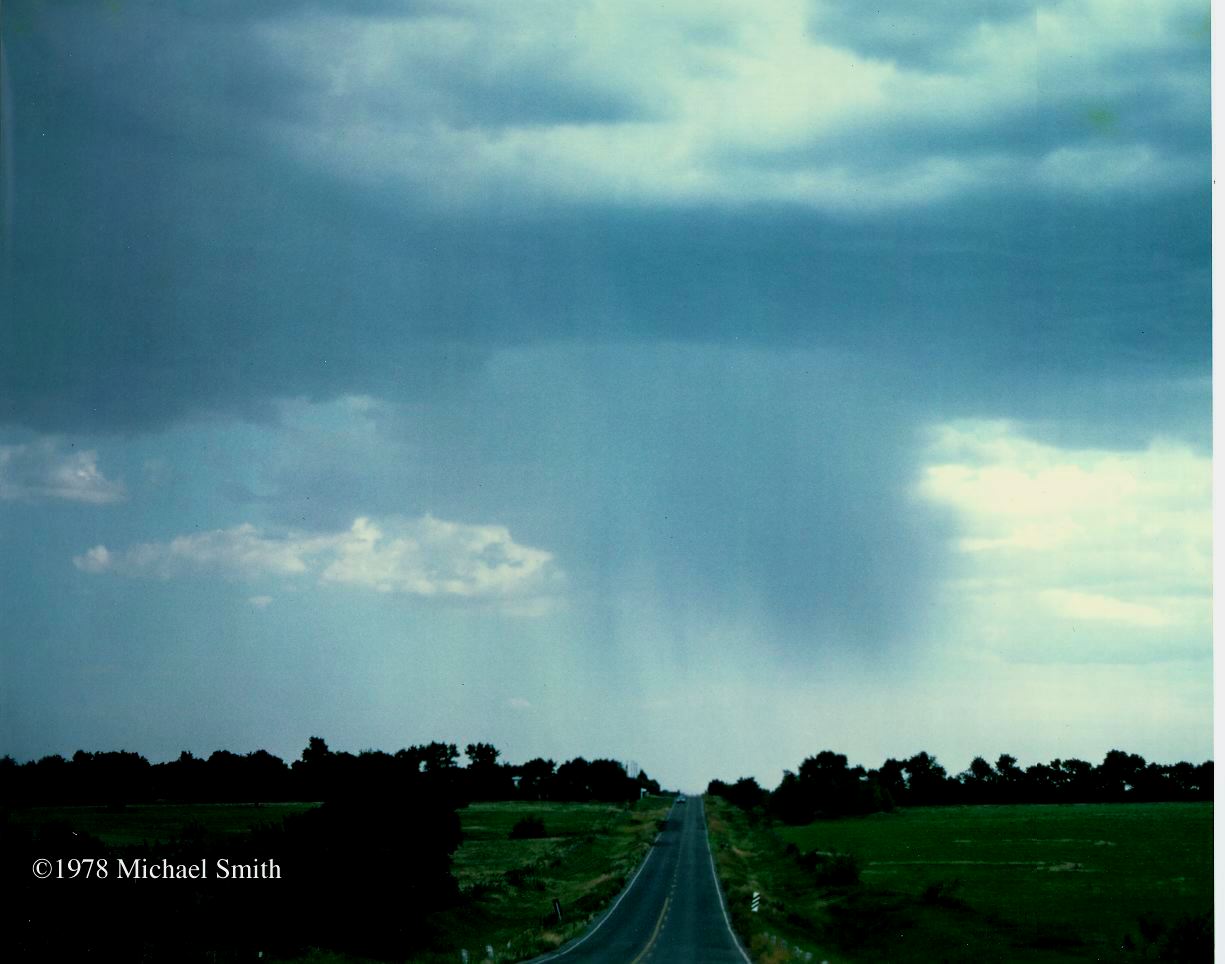 Figure 28.
A "normal" midafternoon, midsummer wet microburst photographed on 1
July 1978 west of Wichita, Kansas (looking south) at intervals of a
minute or less. The intervals are about the same as those in Fig. 29,
and the corresponding phases of evolution of the two microbursts are
displayed right after each other in the following series.
(Photographs ©1978, Michael Smith, provided courtesy of Michael
Smith and WeatherData, Incorporated)
Figure 28.
A "normal" midafternoon, midsummer wet microburst photographed on 1
July 1978 west of Wichita, Kansas (looking south) at intervals of a
minute or less. The intervals are about the same as those in Fig. 29,
and the corresponding phases of evolution of the two microbursts are
displayed right after each other in the following series.
(Photographs ©1978, Michael Smith, provided courtesy of Michael
Smith and WeatherData, Incorporated)
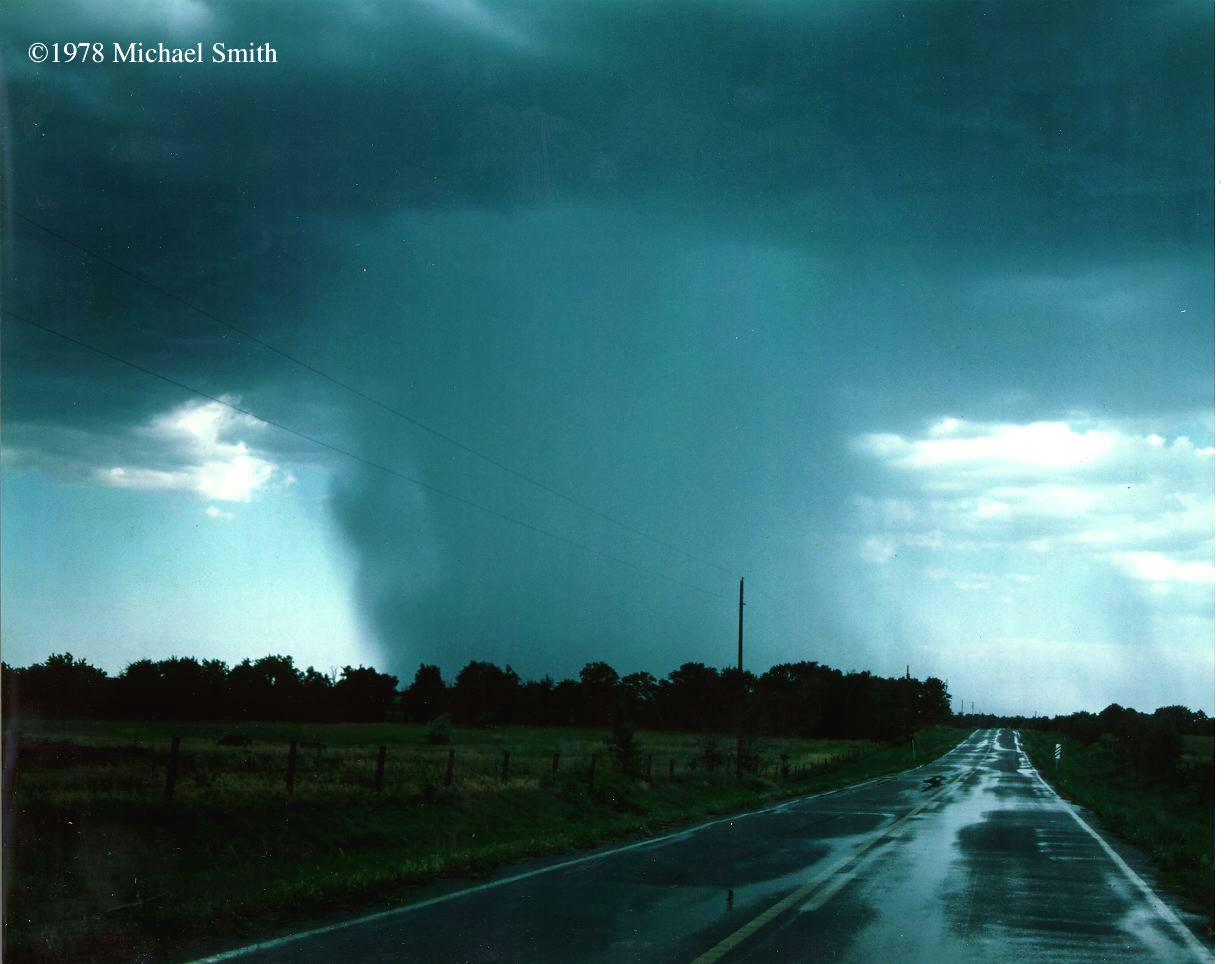 Figure 28.
(Continued)
Figure 28.
(Continued)
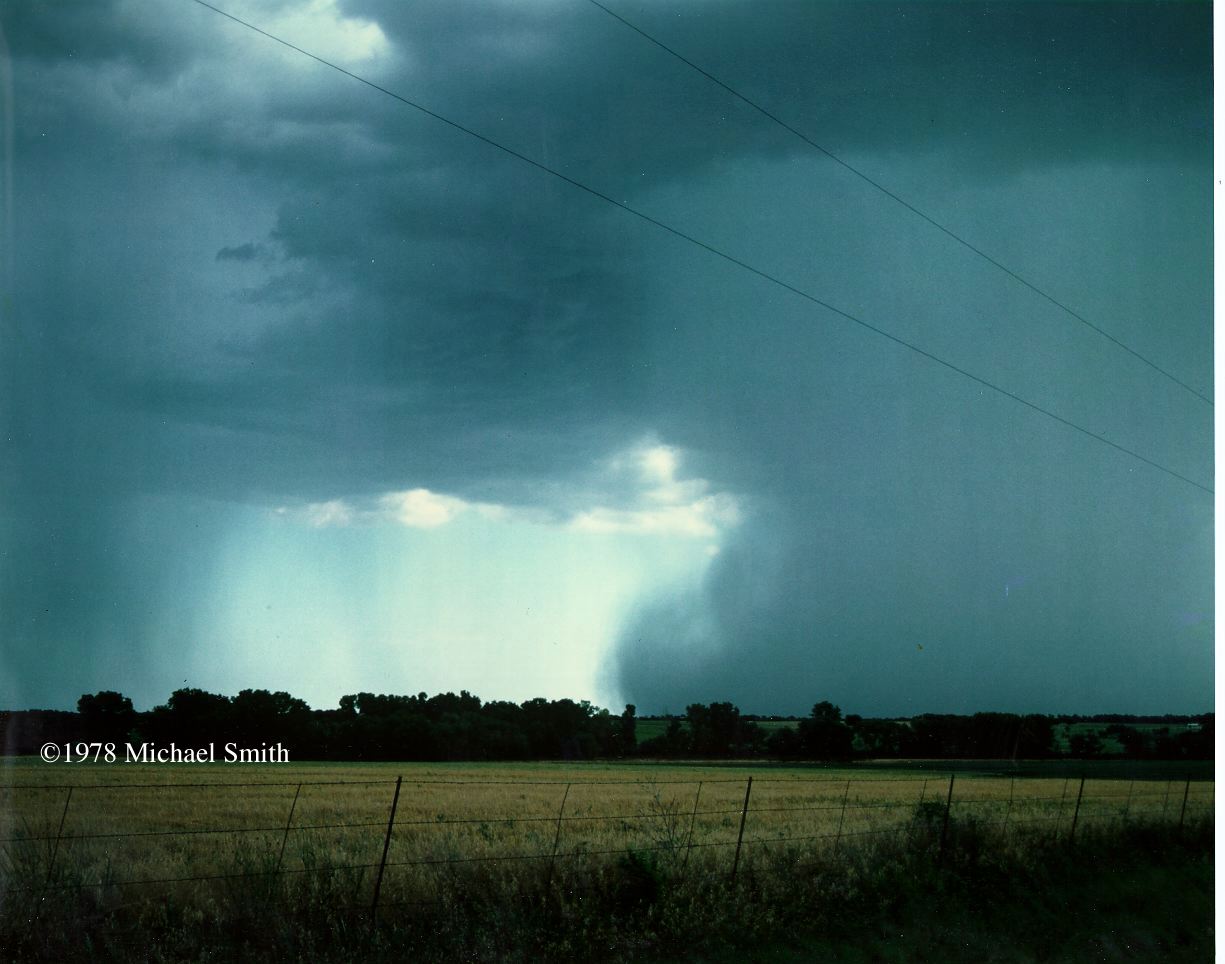 Figure 28.
(Continued)
Figure 28.
(Continued)
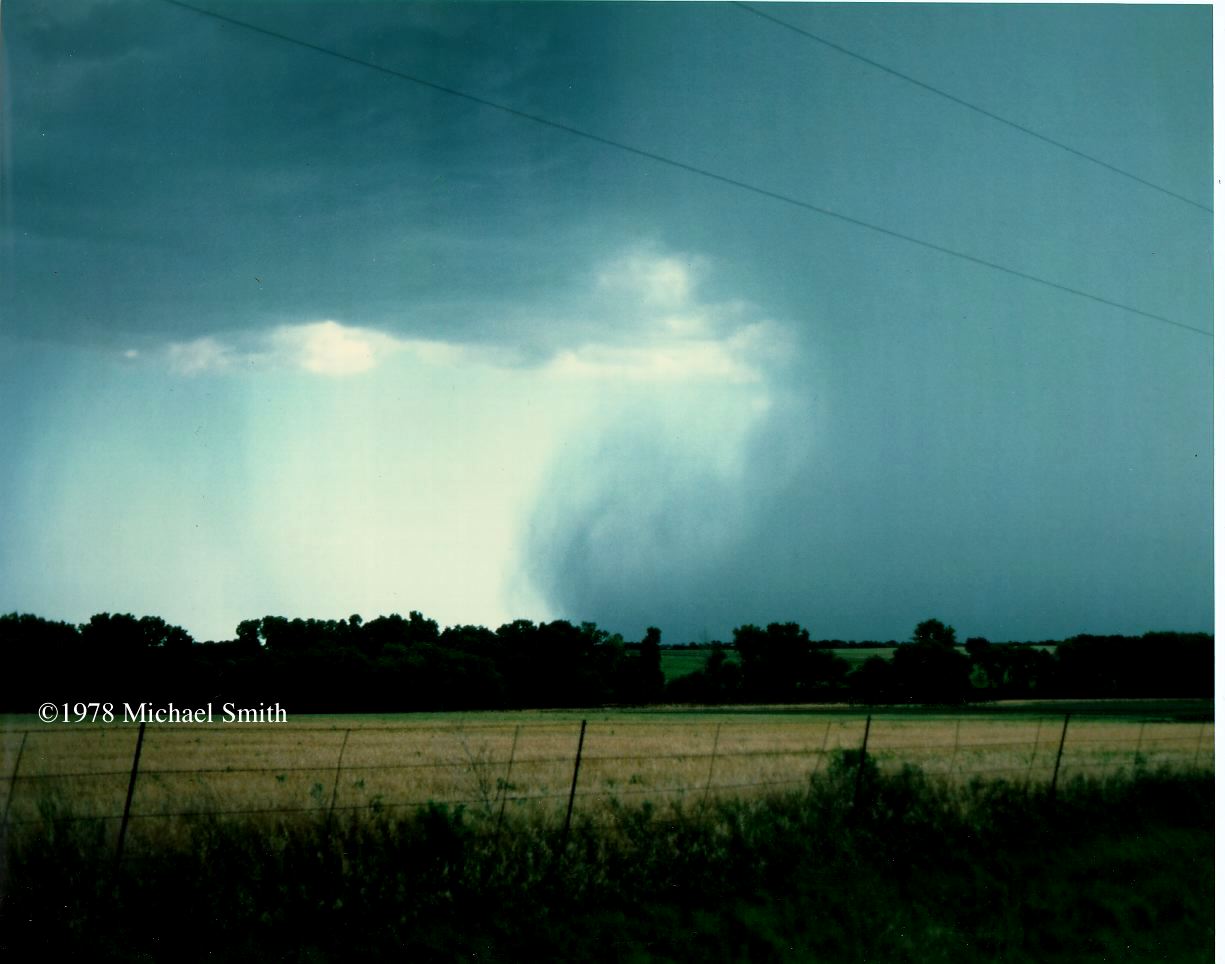 Figure 28.
(Continued)
Figure 28.
(Continued)
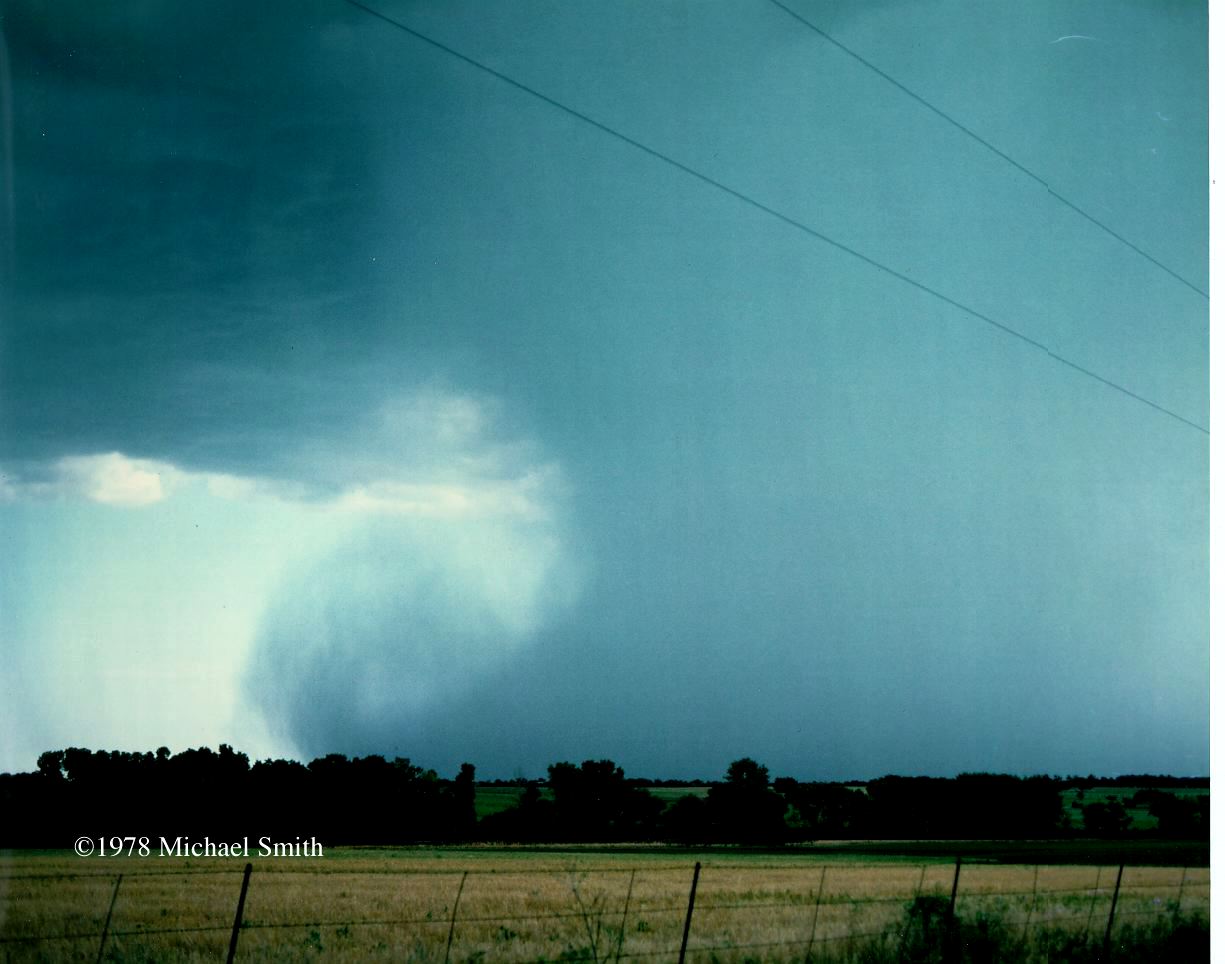 Figure 28.
(Continued)
Figure 28.
(Continued)
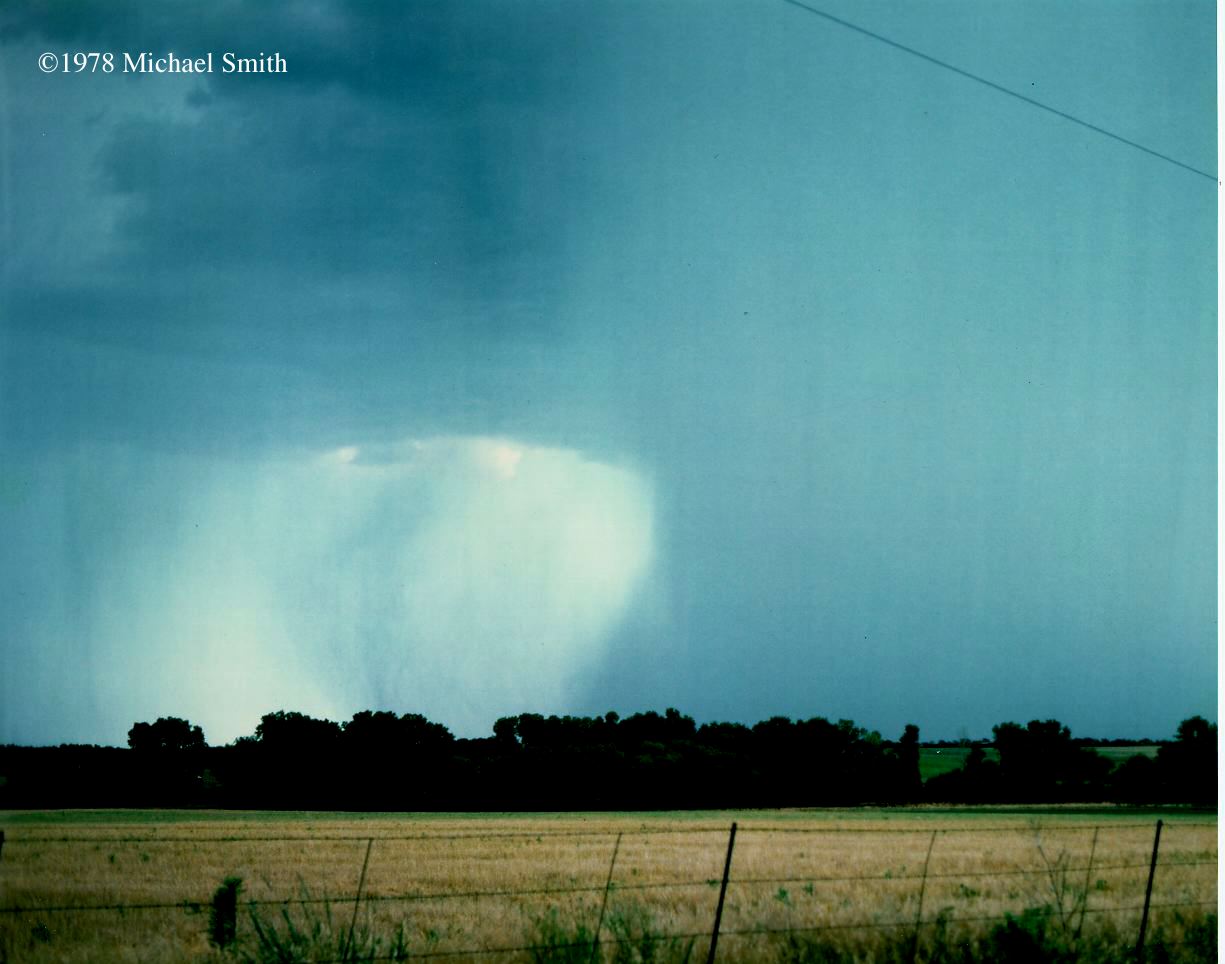 Figure 28.
(Continued)
Figure 28.
(Continued)
Figure 29. An unusual wet microburst over the desert at night, photographed at Tucson lighted by frequent lightning. The intervals are about the same as those in Fig. 28, and the corresponding phases of evolution of the two microbursts are displayed right after each other in the following series. (Photographs ©1984, M. Maier)
return to the Handbook Page
go to the Additions Page
return to the Semi-Official Microburst Handbook Home Page
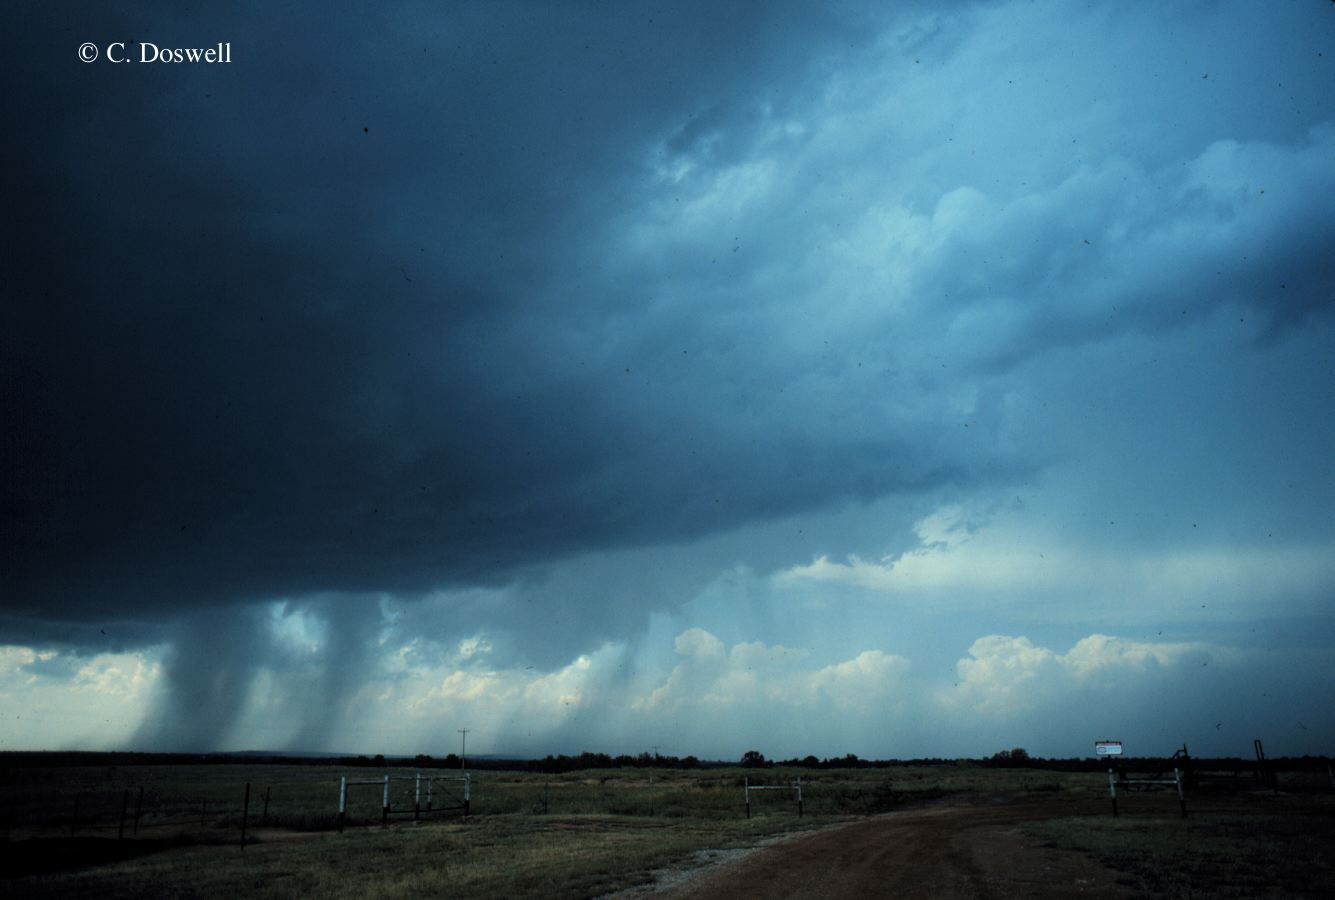 Figure 27