_____________
* Affiliations at time of publication - All now retired from NOAA
This is a Web version of a handbook (published by NOAA) designed to fill a gap that exists between what is available to researchers in the way of detection, and what is available to the public in the way of protection from microbursts -- small-scale, severe storm downdrafts that are a major threat to aircraft during takeoff or landing. The best microburst detectors, such as Doppler radars and lidars, have been indispensable in field projects but until recently were not operational at most major airports. Although Terminal Doppler Weather Radars (TDWR) have been deployed in the United States beginning in the early 1990s, these sensors are unlikely to be available internationally and at smaller airports. This gap in air safety can be filled by predictions that can alert, hours in advance, all those concerned with the threat of a potential microburst occurrence, together with visual identifications that can alert tower and flight crews that a microburst is actually happening.
_____________
Website Note #1: This site consists of three parts.
Website Note #2: There are no more handbooks and posters based on the Handbook still available. I know of no plans to reprint the handbook
_____________
Most recent update: 09 February 2011: Moved to my home website and updated
Aid is provided for spotters who are visually identifying microbursts and for forecasters who identify the environments in which microbursts are likely to happen. Following a discussion of physical models of a microburst environment, on which forecasts are based, two environmental extremes (wet/dry) for microbursts are described and typified by corresponding soundings, and illustrated through photographs that portray the type of sky associated with these environments. A vortex ring model of the flow within a microburst is shown, to aid in identification through its integration of subtle visual clues, which are liberally illustrated in the color photographs. The model accounts for the following characteristics that warn of microbursts: (1) precipitation (or dust) curl that is carried by the wind back up toward cloud base; (2) horizontal bulging near the surface in a precipitation shaft, forming a foot-shaped prominence; (3) an increase rather than a decrease in wind speed as the microburst expands out over the ground; and (4) abrupt surface wind gusts followed by a rapid dissipation of some types of microbursts.
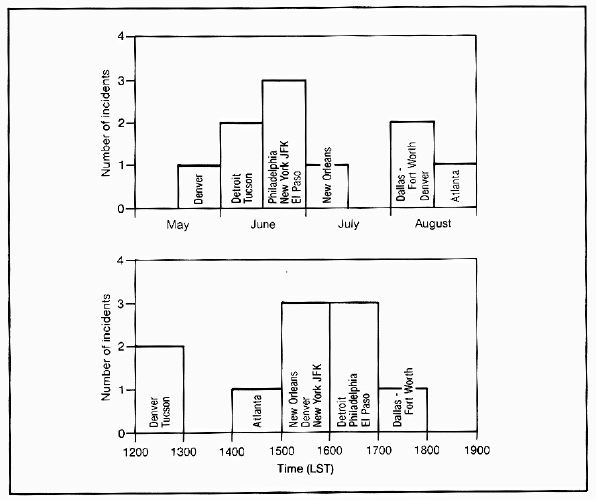
Strong, concentrated downdrafts from convective showers and thunderstorms (downbursts; Fujita 1985) have caused a number of commercial passenger jets to crash on attempted takeoffs and landings (see also Fujita and Byers 1977; Fujita and Caracena 1977). The hazard occurs principally when the spatial scale of the downburst is on the order of a runway length. Because of the importance of this scale, Fujita (1985) defined a microburst as a downburst that extends no more than 4 km (2.2 n mi) over the surface. The smaller spatial scale of a microburst converts into tighter wind shear gradients that are experienced in the penetrating aircraft as more rapid changes in wind vector, perhaps well in of the inertial capabilities of the airplane. That the microburst is just the right scale and intensity to crash an aircraft is evidence by the number of accidents associated with microbursts over about a decade (Fig. 1). Microbursts also pose hazards to small sailboats that are capsized by sudden-shifting, strong winds, and to those fighting forest fires, who may be suddenly engulfed in a fire storm fanned up in an unexpected direction by a microburst.
This handbook explores the detailed, small-scale structure of microbursts, as well as the upper-air conditions that form the setting for microburst-producing storms. The discussion of the environmental setting for microbursts should be of special value to those faced with the task of forecasting them. Smith (1986) suggested that microbursts be classified as observable phenomena. The photographic section will help pilots, controllers, and weather observers in visual identification of microbursts. Such visual identifications will help fill gaps in forecasting and remote sensing of microbursts and furnish the National Weather Service with a means of obtaining observational data on microbursts to complement those from other sources such as the WSR-88D and TDWR Doppler radars.
a. The gust front
At one time, it was widely believed that the gust front (Fig. 2), or leading edge of rain-cooled air, was the main wind-shear threat presented by thunderstorms to aircraft in takeoff or landing. The gust front is formed along the leading edges of large domes of rain-cooled air that result from the amalgamation of cold downdrafts from individual thunderstorm cells, and may be large enough to be analyzed on the National Weather Service (NWS) surface charts as meso-scale (or bubble) high pressure areas (Fujita 1963). High surface pressure here results from the denser, cool air that piles up over the surface in a dome. At the edge of this dome, the horizontal surface pressure gradient pushes the cool air outward into the warmer air as a density current (Charba 1974: Hall et al. 1976). At the leading edge of this current, the gust front, there is the dynamic clash between the cool outflowing air and the warmer thunderstorm inflow that produces the characteristic windshift, temperature drop, and gusty wind that precede a thunderstorm.
b. Downburst and microburst
Studies of two wind-shear-related crashes that happened in 1975 have shown that the accidents were caused by the aircraft's encountering concentrated thunderstorm downdrafts rather than gust fronts. In his weather analysis of the Eastern Flight 66 crash at J.F. Kennedy International Airport of June 1975, Fujita (1976) showed a strong concentrated along the landing approach very near the crash site (see also Fujita and Byers 1977). An analysis of surface winds at Stapleton International Airport of the crash of Continental Flight 469 in August 1975 shows a concentrated, strong outflow that strongly suggests the impact of a small-scale jet-like downdraft (Caracena 1976; Fujita and Caracena 1977).
Earlier, a court investigating a wind-shear-related accident at Kano, Nigeria, that happened 24 June 1956 during a thunderstorm (see Stewart 1958), concluded that "the accident was the result of a loss of height and air speed caused by the aircraft encountering, at approximately 75 m (250 ft) after takeoff, an unpredictable thunderstorm cell which gave rise to a sudden reversal of wind direction." This ruling, perhaps because of its tentative wording, does not seem to have alerted the rest of the aviation world to the dangers of thunderstorm downdrafts to aircraft landing.
Prompted by the Eastern Flight 66 weather analysis and small-scale starburst wind damage patterns (Fig. 3a) that he observed, Fujita (1976) coined the term "downburst" to refer to a concentrated severe downdraft that induces an outward burst of damaging winds at the surface, to distinguish this feature from a normal downdraft, in much the same vein as defining a severe tropical storm as a hurricane (see Fujita, 1985). Because accident data showed that wind-shear accidents have tended to occur as a result of low-level aircraft encounters with small-scale downbursts about runway size, Fujita defined the "microburst" as a downburst of maximum horizontal extent of 4 km (2.2 km).
In this handbook, we use the term downburst when no size scale is specified, or when speaking of a severe downdraft of horizontal dimensions exceeding 4 km (2.2 n mi). In some situations a downburst may begin as a microburst but subsequently spread out and continue to be strong enough to be classified as a larger scale downburst; however, it is when the downdraft-outflow structure is compact, as in a microburst, that it poses a serious hazard to aircraft.
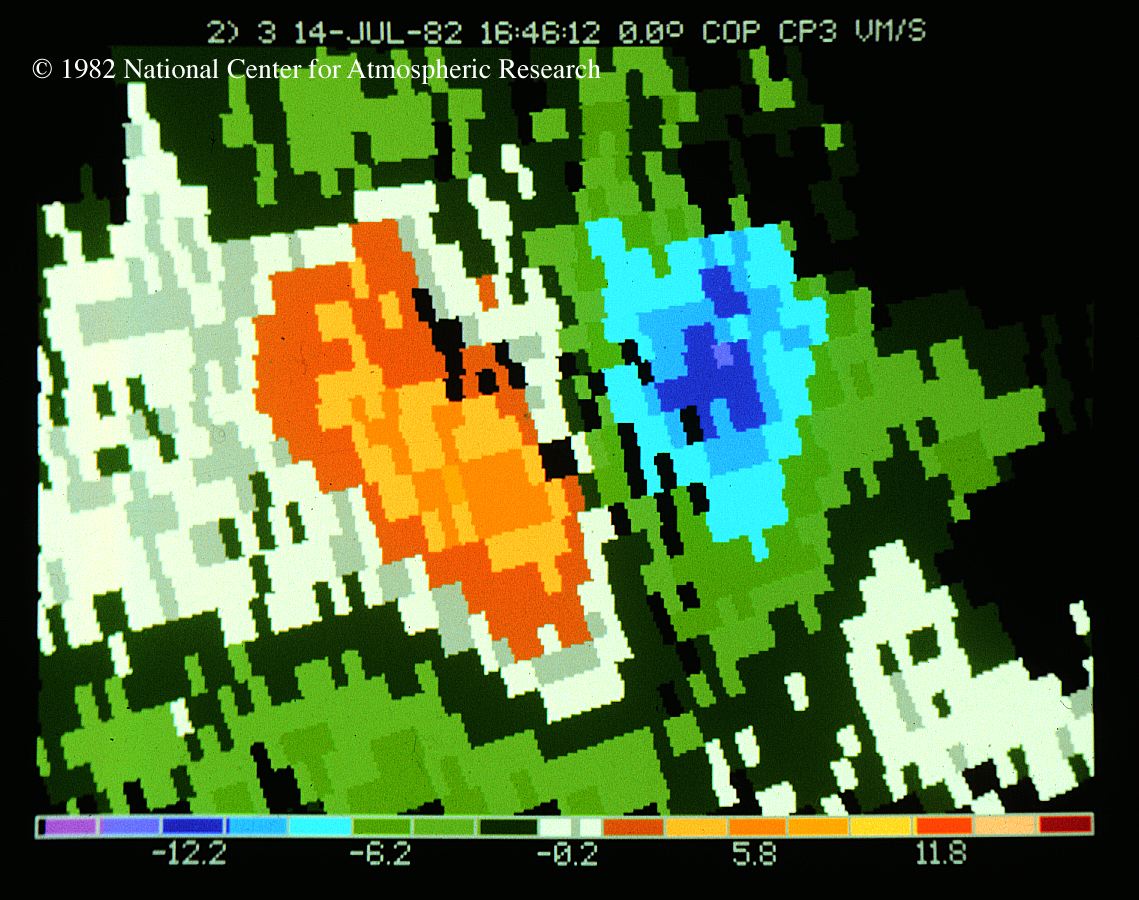
Identification of downbursts on Doppler radar is of general interest and is important to air safety wherever such radars are available at airports. An example of a Doppler radar signature for microbursts is presented in Fig. 3b. Note that the Doppler shift pattern is dipolar, similar to a mesocyclone signature, but oriented such that the axis of the dipole is aligned roughly parallel to the beam instead of orthogonal to it. This orientation is due to the strong divergence in the near-surface wind at the base of a microburst. Divergence causes the strong gradient in the radial component of the wind that is responsible for the dipole Doppler shift in alignment with the beam. Doppler radar detection of microbursts is an important topic in itself; here we concentrate on visual and other physical aspects of microbursts.
a. Flow against a flat plate
Perhaps the simplest model of a microburst is that of the steady flow against a flat plate with or without friction and without buoyancy (Batchelor 1970). Although there are no hydrostatic pressure changes in this model, there is an impact pressure field that causes the downflow component to decelerate as air approaches the surface and the horizontal component of the wind to accelerate outward from the impact center. For flow fields on the scale of downdrafts from cumulonimbi (1 km, or 0.5 n I) and downflow components of about 20 m s-1 (3900 ft per in), this model predicts sharp-impact, high-pressure areas about 1 km (0.5 n mi) in diameter and about 2 mb (0.06 in mercury) in amplitude.
b. Pressure nose
The Thunderstorm Project report (Byers and Braham 1949) relates that pressure areas smaller than thunderstorm mesohighs (pressure noses) were observed. They were less than 8 km (4.3 n mi) in diameter (the network spacing of meteorological instruments) and lasted only a few minutes. These pressure noses were observed to occur at approximately the commencement of the mature phase of a thunderstorm cell, that is, when rain first began to reach the ground.
Since the Thunderstorm Project, closer spaced and faster responding instruments have revealed tighter and stronger pressure noses. Within a microburst, a pressure nose of 2.4 mb (0.07 in mercury), lasting only 3 minutes, was observed in the Florida Area Cumulus Experiment (FACE), 1 July 1975 (Caracena and Maier, 1987). In another microburst, at Dulles International Airport, 26 June 1978, a 5-mb (0.15 in mercury) pressure nose occurred (Bedard, 1984). A pressure nose of about 4 mb (0.12 in mercury) and with horizontal extent less than 2 km (1.1 n mi), was analyzed by Fujita (1985). It occurred in a microburst that passed over Andrews AFB accompanied by winds in excess of 62 m s-1 (120 kt), minutes after Air Force One had landed on 1 August 1983. Although tree damage marked the path of this microburst, peak winds were less than 5 m s-1 (10 kt) only 4 km (2.2 n. mi) to the left of the microburst track.
The strong pressure nose that is associated with microbursts suggests that they behave something like what is expected from the model of flow against a flat plate, but with negative buoyancy adding an undetermined hydrostatic component of pressure. However, this model fails to account for the maximum wind gusts associated with some observed microburst pressure noses. For example, the wind speed of the FACE microburst was estimated as 30 m s-1 (58 kt), but the pressure nose of 2.4 mb (0.07 in mercury) suggests a maximum wind speed of only 20 m s-1 (39 kt) (through Bernoulli's equation, following the air streamline along the ground from the stagnation point of impact to ambient pressure). Although this discrepancy can be explained by assuming that the stagnation point of the FACE microburst did not come near the pressure sensor (an accelerated microbarograph), it is more difficult to explain peak gusts in excess of 60 m s-1 (117 kt) from a pressure nose of only 4 mb (0.12 in mercury) in the Andrews AFB microburst.
There is, however, more to the pressure picture than just impact pressure in that pressure drops as well as rises are observed in microbursts. In the Andrews AFB microburst for example, Fujita (1985) analyzed a low-pressure ring surrounding a high-pressure nose. Bedard et al. (1987) also observed a pressure drop within an impacting downdraft. This low-pressure ring is not a feature of the model of a flow against a flat plate, and therefore suggests that a better model is needed to explain all the known dynamical features of the microburst.
c. Vortex-ring circulation in a microburst
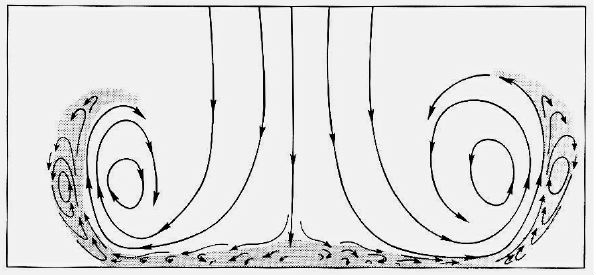
A known dynamical feature that can cause a ring of low pressure on the edge of a downdraft is some kind of circulation in the form of a vortex ring surrounding the downdraft core. Caracena (1982) suggested that airflow in a microburst may be structured as a vortex ring (Fig. 4) having a downward circulation at the center that reinforces the downdraft, and a return updraft around the periphery. A vortex instability appearing as the roll-up of the sides of a sharp-edged, neutrally buoyant jet impinging on a flat surface was observed by Didden and Ho (1985) in the laboratory. They noted that this instability increased the horizontal speed at the outer edge of the surface boundary layer by 1.6 times the initial velocity of the jet as the vortex passed over. A vortex roll-up of a microburst with precipitation curl (Fig. 5) has been observed in numerical simulations of convective downdrafts as well (Droegemeier, personal communication 1987; see also Babcock and Droegemeier 1989), and photographs of microbursts are suggestive of vortex rings in the curling plumes of dust (Fig. 6) (see Fujita 1983) or precipitation spray.
The vortex ring model of a microburst's circulation is corroborated by a number of pressure and photographic observations taken during field experiments. A small microburst passing through the Boulder Atmospheric Observatory tower showed a drop in pressure with the main downdraft (Bedard et al. 1987). Fujita (1983) observed that a microburst passing over Portable Automated Mesonet (PAM) station No. 3 during JAWS on 19 May 1982 produced a ring of low pressure surrounding its high-pressure core. Photographic evidence is furnished by Fujita's (1985) photograph of a microburst rendered visible as a ring of dust (see Fig. 15). Further, Waranauskas (see also Fujita 1985) showed the detailed vertical structure of such a ring that strongly suggests a vortex circulation.
The dynamics of an expanding ring in the deformation field at the base of a strong downdraft in the vortex ring model may explain why a microburst is observed to strengthen as it expands after surface impact (Wilson et al., 1984) at a time when it should be weakening because of frictional dissipation. The size and dynamics of a microburst may be dependent upon the scale and type of precipitation in a maturing cell. The genesis of a microburst from a downdraft may proceed as follows (see Fig. 4 and Fig. 7):
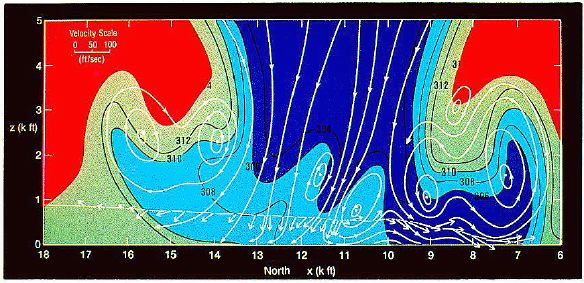
In fact, there is evidence that not only one, but several vortex rings may organize at the base of a severe downdraft (Fig. 7), giving embedded elements of smaller scale, extreme wind shear and turbulence within the already dangerous, larger scale flow structure of a microburst. This may have been the situation in two accident cases, Eastern Flight 66 and Pan American Flight 769 (see Caracena et al. 1983; Fujita 1983) in which periodic, discrete microbursts were observed several minutes apart.
The presence of multiple vortex rings was suggested in wind analyses (Caracena et al. 1986; Fujita 1986) based on data from the flight recorder of a commercial passenger airliner that crashed as a result of encountering a microburst on final approach (see Fig. 7). The aircraft successfully traversed the downdraft [at about 200 m (650 ft) above the surface] only to crash as it encountered several strong vortices in the low-level outflow.
The periodicity of vortex ring instability explains the wide variety of microburst life times and characteristics. Most microbursts are rather short-lived (~5 min), but others have been observed to last four or even six times as long (Wilson et al. 1984). Vortex ring instability is a parasitic feature of a downdraft that acts as a dissipative mechanism. In situations where the flux of air in a downdraft is not large, one vortex ring may be enough to dissipate the downdraft energy; the result would be an impulsive, short-lived microburst. For downdrafts with higher fluxes, several vortex rings may be initiated, resulting in a series of discrete microbursts of short duration and spaced several minutes apart. That happened in the Eastern Flight 66 crash (Fujita and Byers 1977); three microbursts occurred along the landing approach within a period of 9 min. In the crash of Pan American Flight 759, two impulsive microbursts occurred in approximately the same location within a period of about 7 min. For still higher downdraft fluxes the vortices generated become part of a larger scale circulation that has a much longer lifetime than each vortex element. Such was the situation at Dallas-Fort Worth during the crash of Delta Flight 191 as reported by Fujita (1986) and Caracena et al. (1986).
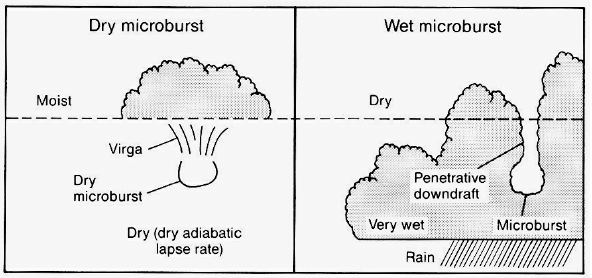
A great variety of environments can produce microbursts. Of particular interest are two extreme types in which microbursts can occur in large numbers (Fig. 8). One is the extremely dry environment in which moist convection is just barely possible, and the other is the extremely wet environment, which can produce microbursts embedded in very heavy rain.
a. The dry extreme
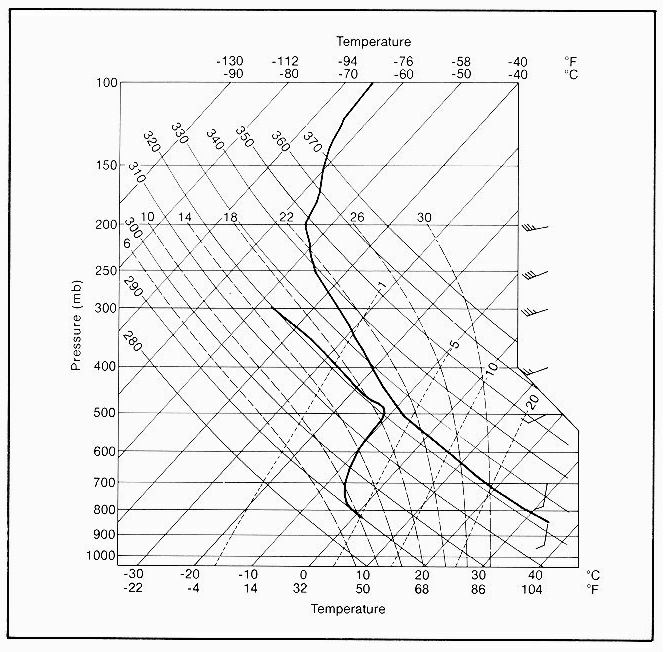
The dry convective environment was first described by Braham (1952) and Krumm (1954) for the Western Plateau region of the United States. Brown et al. (1982) extended this discussion and presented the following conceptual model for the Front Range area of Colorado: In the extremely dry environment, where moist convection is just barely possible, cumulus clouds with very high bases form in a more protected environment that is nearly saturated at about 3 km (9800 ft) above the surface; below this high-based cloud layer there is a deep, dry adiabatic layer; dew point depressions are higher nearer the surface where they may approach 30oC (86oF). Examples of dry microburst soundings are presented in Fig. 9a and Fig. 9b. Wakimoto (1985) discussed the environmental characteristics of dry microbursts. Caracena et al. (1983) and Caracena and Flueck (1987a, b) discussed forecasting techniques for this type of dry extreme microburst that are based on linear predictive models and discriminate function analysis. Of all the microburst-producing situations, the dry extreme is probably the best understood.
b. The wet extreme
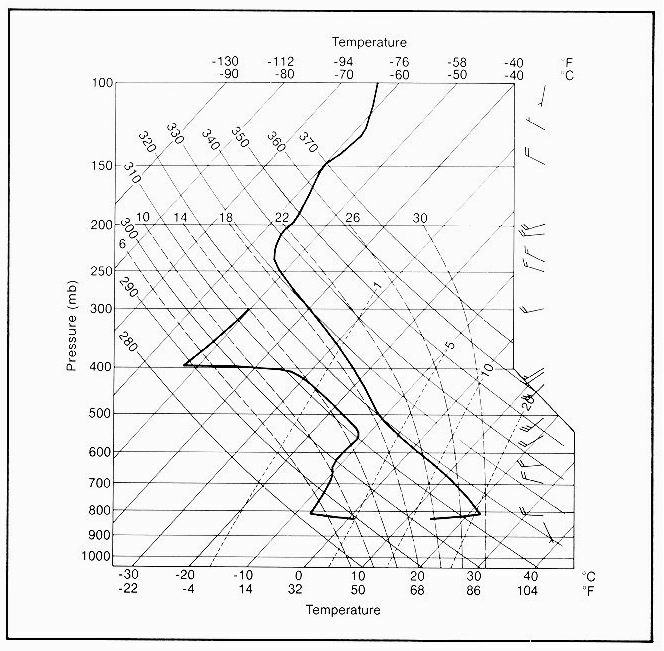
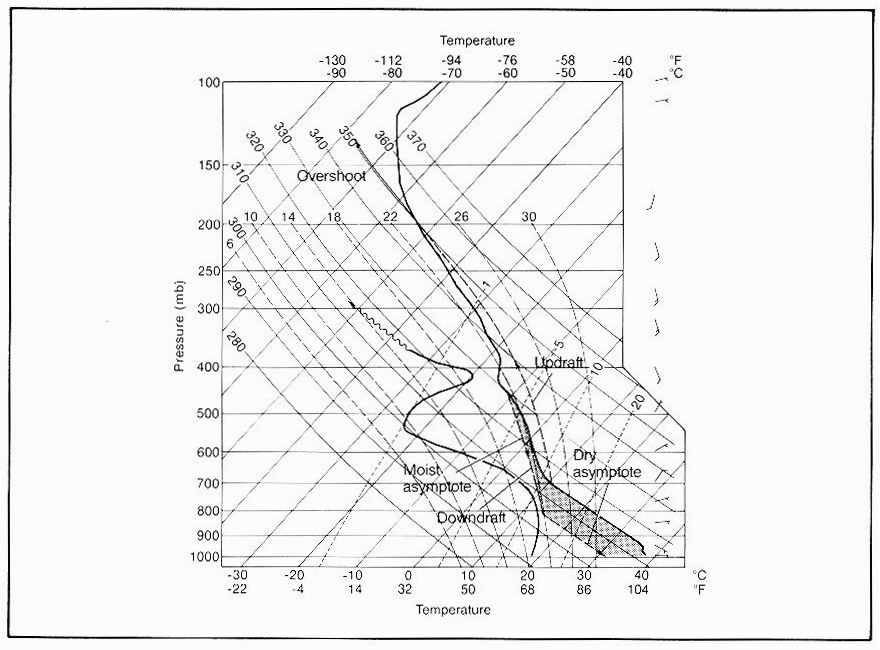
The wet extreme in microburst environments has not been studied in the same detail as the dry extreme, but the pattern has been recognized and noted (Fig. 8). Figure 10 shows a typical sounding pattern for a wet microburst. The wet microburst environment is marked by a deep, nearly saturated layer with a nearly moist pseudoadiabatic lapse rate that is topped by an elevated dry layer. The equivalent potential temperature of the dry layer is cold enough and the layer is sufficiently high above the surface that, when it is reduced to its wet bulb temperature by saturation and mixed (in equal parts) with the warm updraft, there is still enough negatively buoyant potential energy to drive a severe downdraft through the sinking of such a mixed parcel to the surface. This method of computing the downdraft potential is a modified form of a technique proposed by Foster (1958) and described further by Caracena and Maier (1987). Foster used the fixed layer between 700 and 500 mb to compute the downdraft potential energy, whereas Caracena and Maier used floating levels that center the dry layer on the potentially coolest air.
c. Intermediate environment
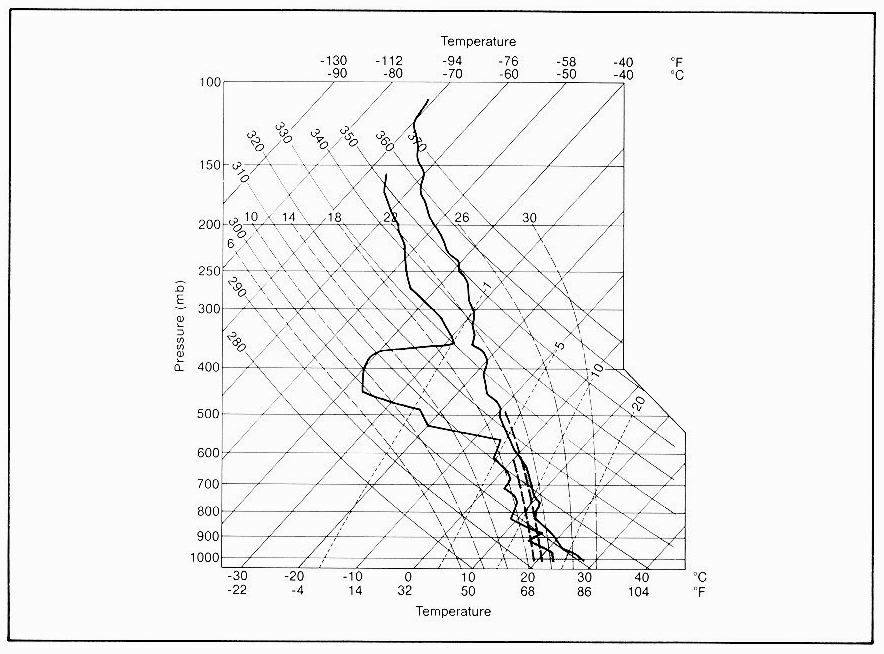
In Texas and other states eastward along the coast of the Gulf of Mexico microbursts occur in environments that fit neither the wet nor dry conceptual models presented above, but rather have some characteristics of both. The reconstructed sounding for Dallas-Fort Worth International Airport (DFW) is typical for such an environment (Fig. 11; Caracena et al. 1986). Read (See Sohl et al. 1987) analyzed soundings for microburst events in northern Texas having similar soundings and found the following common characteristics, which in combination should be considered indicators of microburst potential.
These sounding characteristics indicate an intermediate microburst environment in which subcloud evaporation is still quite capable of producing a microburst, but in which the absolute humidity is high enough to produce very heavy rain as well. Further, in an intermediate environment, unlike the situation in the dry microburst environment, the potential, strong buoyancy in cumulonimbi can lead to graupel and hail formation that may add additional cooling and other not-well-understood processes that may enhance the downdraft. In addition, the presence of an elevated dry layer may be favorable for downdraft initiation due to entrainment of air from the dry layer.
d. Forecasting microburst velocity from the local sounding
Maximum downdraft speeds can be estimated from local sounding data. Srivistava (1985), for example, developed a one-dimensional evaporatively driven downdraft model that uses such parameters as raindrop size distributions, rain-water mixing ratios, and sub-cloud lapse rates to predict the maximum velocity in a downdraft. This model indicates that the downdraft maximizes when rainwater with a high mixing ratio is dispersed as very small drops and falls into a deep dry-adiabatic sub-cloud layer. A simpler model, presented by Wakimoto (1985), estimates the maximum downdraft speed for a dry microburst from sounding and mesoscale network data. Caracena and Maier (1987) modified Foster's (1958) technique to estimate the maximum downdraft speed for a wet microburst from local sounding data alone. The most useful results for forecasters, however, would be some relatively simple index for estimating potential downdraft strengths from conventional sounding and surface data. At present the authors know of no sure index for this purpose.
Photographic documentation combined with theoretical treatment (Sec. 2) furnishes a powerful basis for visually identifying microbursts. Skill in such identification is important for pilots, controllers, and weather observers; identification of microbursts may be the final line of defense in avoiding a microburst-related accident or disaster.
Visual identification may be affected by the observer's perception of size and distance. As defined by Fujita (1985), a microburst is a downburst having a horizontal dimension at the surface no greater than 4 km (2.2 n mi). The spotter may be unsure of the exact horizontal dimension of a downburst that is seen. Dynamically, however, there may be little or no difference on an aircraft between a strong downburst with 5-km (2.7-n mi) diameter and a weak microburst. In some cases, such as the one reported by Caracena and Maier (1987), a downburst may initially reach the surface as a microburst (or perhaps several microbursts) and subsequently expand into a larger scale downburst (macroburst). Indeed, it is conceivable that the parent storm could continue to develop into a supercell storm or squall line, resulting in the downburst's developing continuously into a large-scale gust front. The classification of an event as a microburst, macroburst, or gust front is a matter of judgment on the part of the spotter. The need for such judgment is not unprecedented. Trained observers are currently asked to estimate cloud height, degree of cloud cover, visibility, etc. Thus the spotter may be sure that a downburst is a microburst because its size can be estimated relative to features of known scales, such as a grid of roads 1 mile (1.6 km) apart, a copse of trees, or a row of telephone poles. Even when not certain whether an event is a microburst or macroburst, the spotter can always call it simply a downburst.
a. Dry microbursts
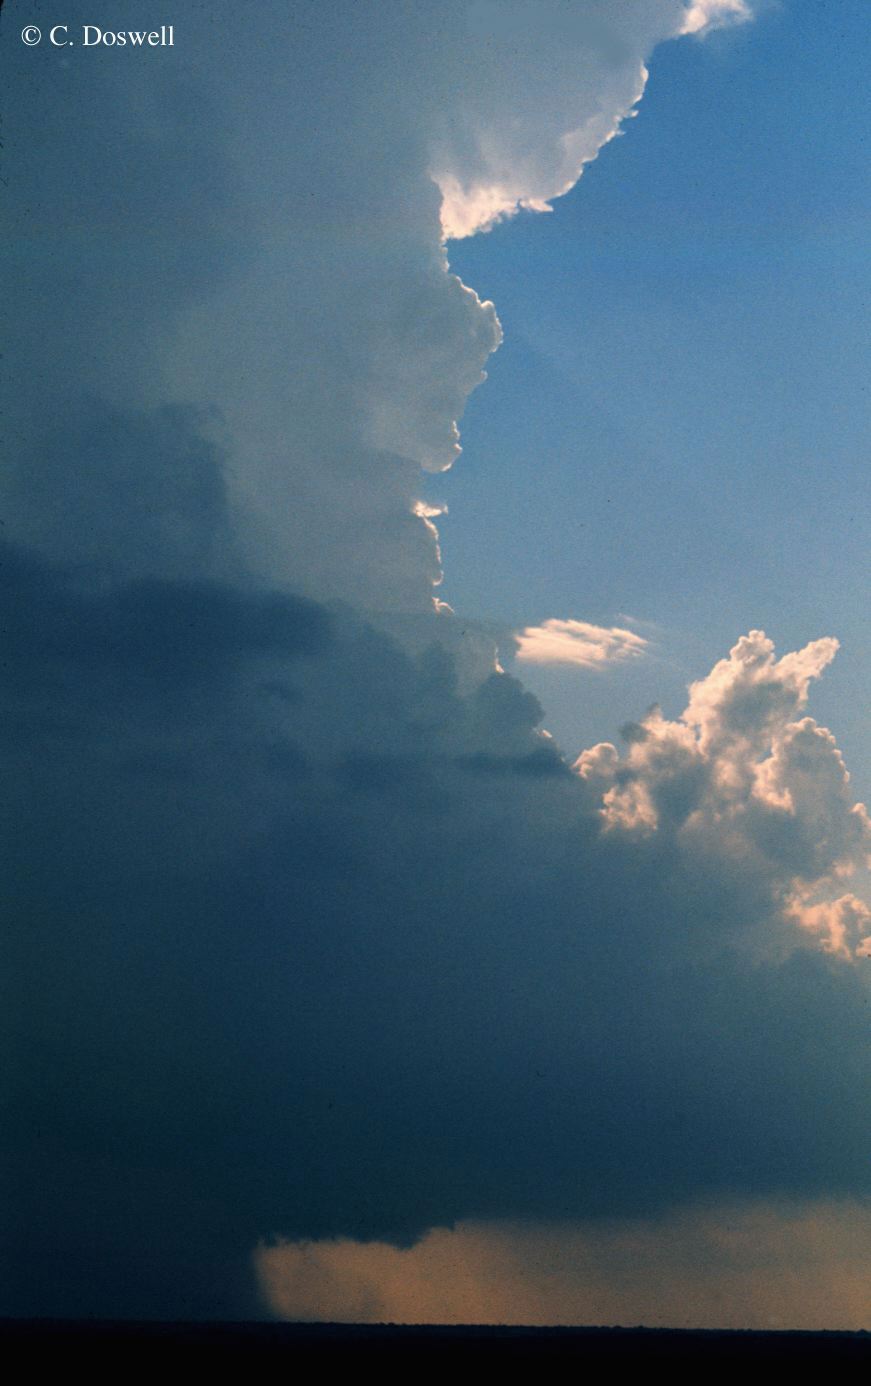
Figure 6 depicts a typical dry-microburst-producing storm that has a high base and is producing little (<0.25 cm, or <0.1 in) or no surface rain. In such extremely dry situations, the storms may not produce lightning even though the high-based cumulus clouds have a fibrous appearance and a prominent anvil (Fig. 12).
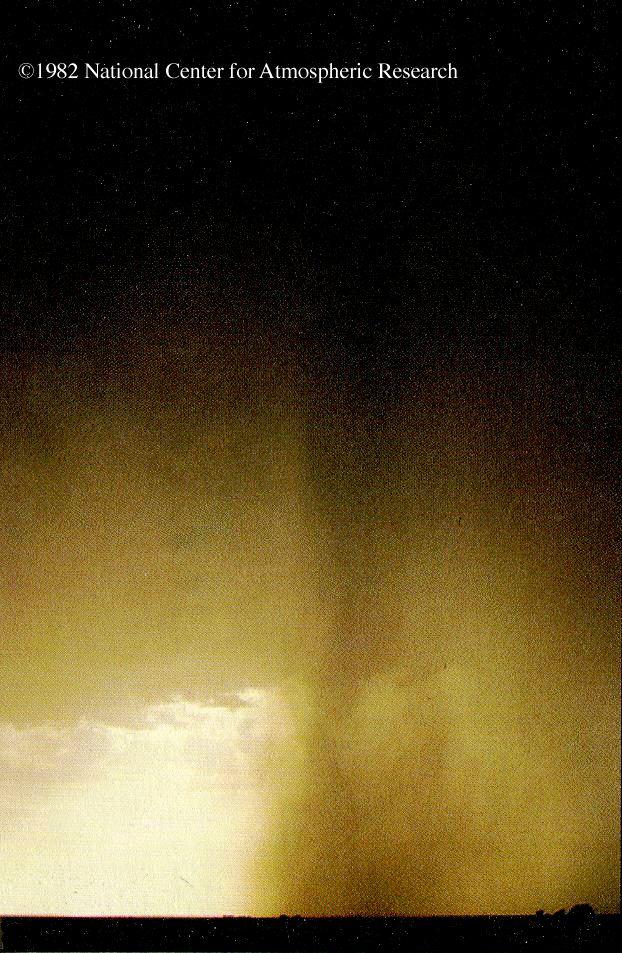
Figure 13 shows a typical dry microburst that is just beginning to spread out over the surface. The microburst is rendered visible by an expanding ring of dust under a virga shaft descending from a high-based cumulonimbus. The precipitation largely evaporates before reaching the surface, so the surface rainfall is probably no more than a trace. As the microburst pictured in Fig 13 developed, the ring of dust spread out over the surface (Fig. 14). A photograph by Fujita (1985) in Fig. 15 shows the typical, expanded ring of dust at close range. Very close to the site of a dry microburst, blowing dust might be seen but only a portion of the ring might be visible ( Fig. 16).
The observer must be especially watchful for dry microburst conditions that at first glance may present a fair-weather appearance (Fig. 17). About 20 minutes after the photograph in Fig. 17a was taken, dry microbursts began to raise clouds of dust in the area (Fig. 17b). Anvils of large dry-line thunderstorms may also produce high-level virga (Fig. 18) that can result in dry microbursts at rather large distances from the parent hail-storm and its associated heavy radar echo. In this case pilots and others watching weather conditions on their radar scopes could have easily misjudged the weather hazards in areas far from the storm's heavy radar echo. By themselves radar echoes therefore may be very misleading, and it may take Doppler radar or knowledgeable observers to spot the danger of a dry microburst.
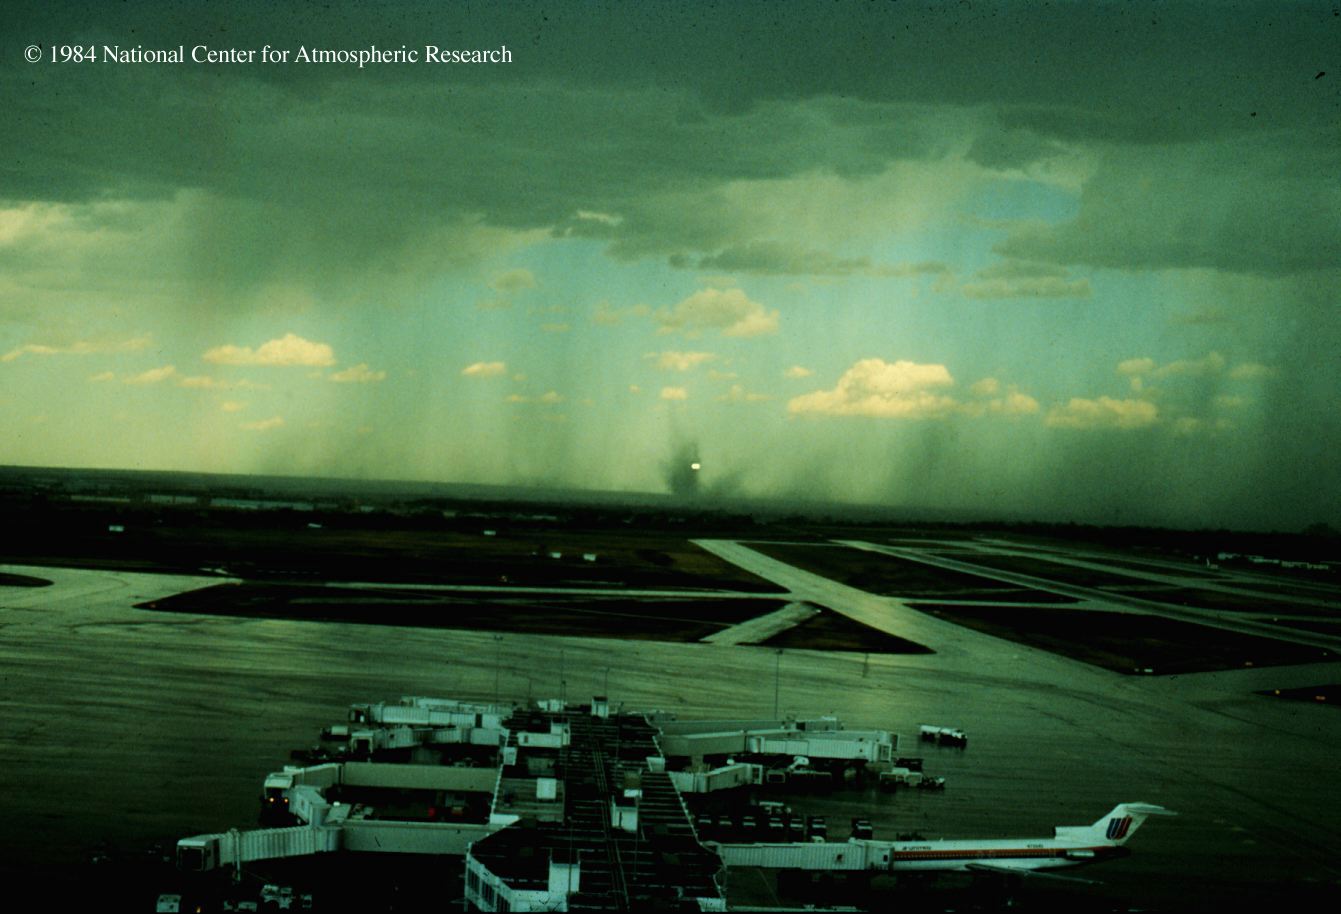
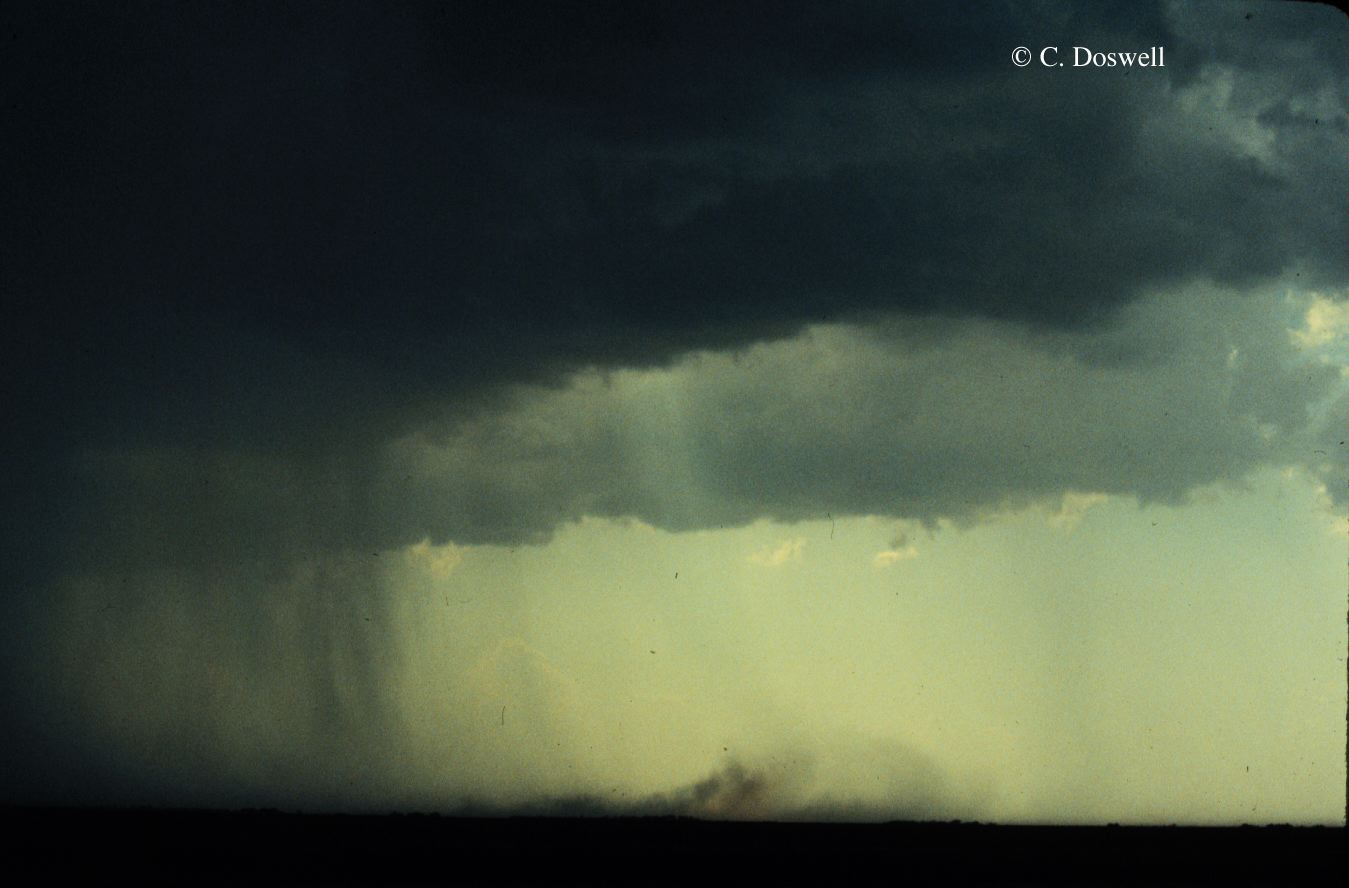
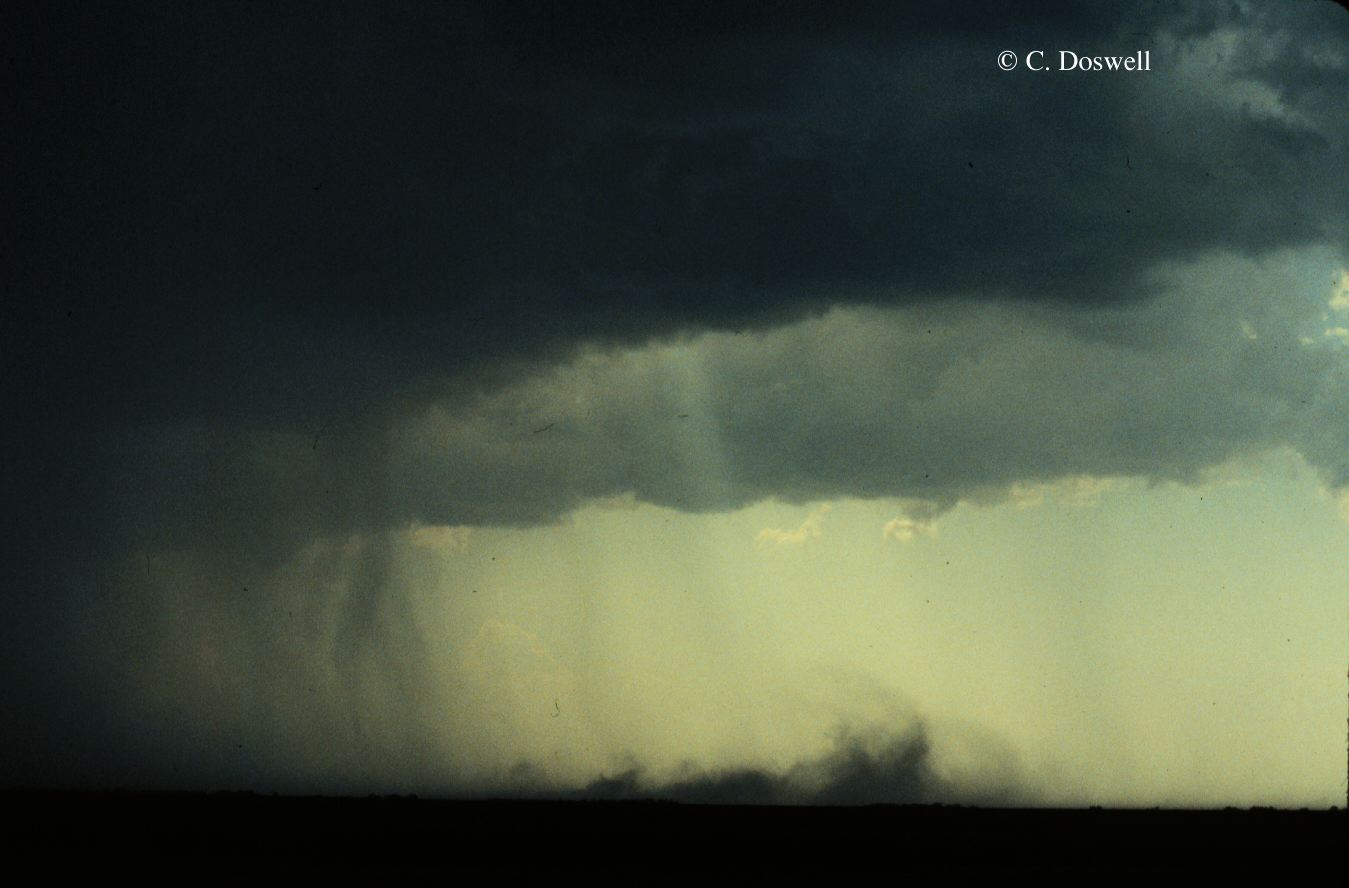
There is, of course, a continuous range of weather condition between the dry and wet extremes of microburst-producing environments. High-based cumulonimbi may produce light but measurable rain at the surface and raise clouds of blowing dust, as in Fig. 19 where a rain shower has spawned a "gustnado" (gust front tornado) in the path of an approaching aircraft. High-based cumulonimbi may also produce heavy rain. Figure 20 gives visual evidence of a rain-embedded microburst: strong winds at the base of the rain shaft have spread precipitation well beyond the edge of the rain shaft aloft, forming a sort of low-level foot shape extending left of the rain shaft. Further, note the suggestion of a precipitation upward curl near the toe end of the foot.
High-based thunderstorms with heavy rain should be of particular concern in air safety since they signal a deep mixed layer, with a high lapse rate, and plenty of precipitation to fuel a strong downdraft through the cooling-phase changes of hydrometeors. For example, at Dallas-Fort Worth International Airport a thunderstorm based about 3 km (1.6 n mi) above the surface produced intense windshear that caused Delta Flight 191 to crash (see Caracena et al., 1986).
b. Wet microbursts
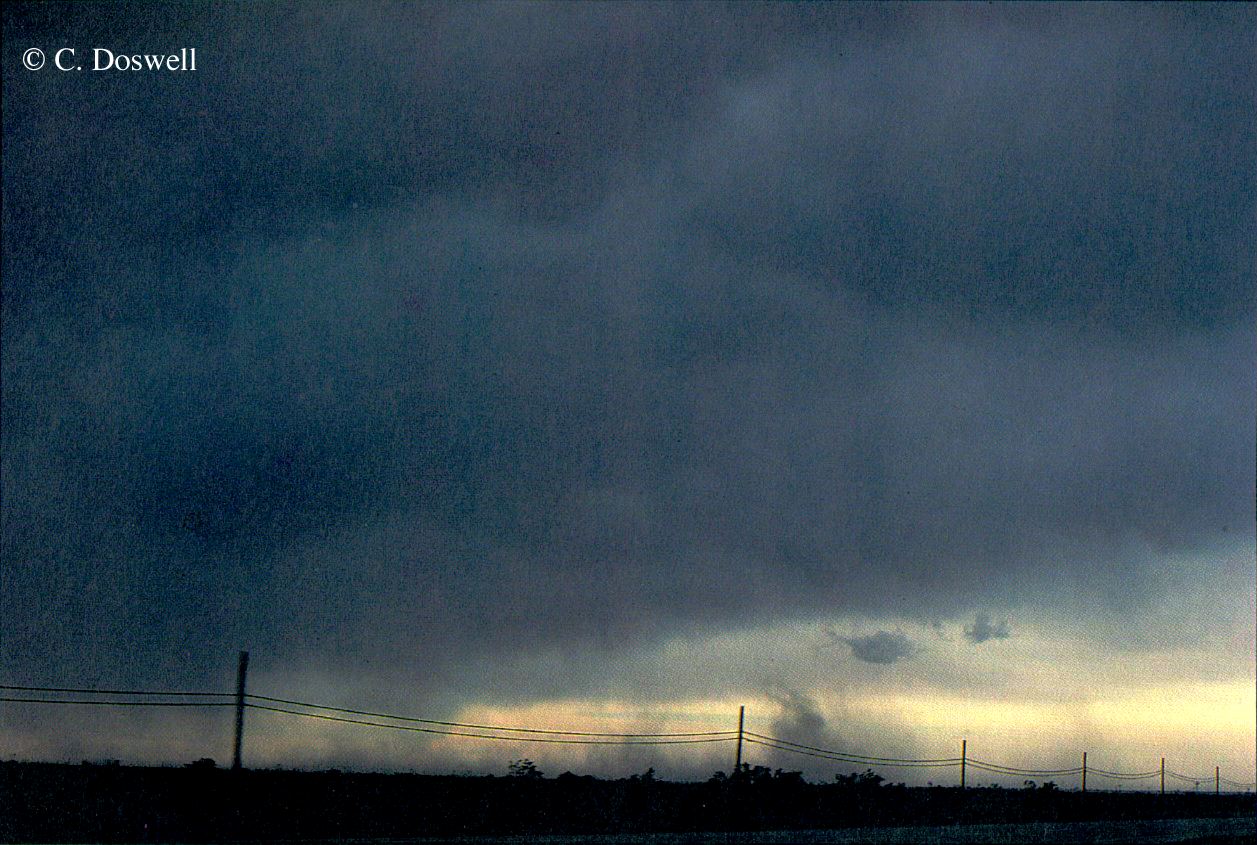
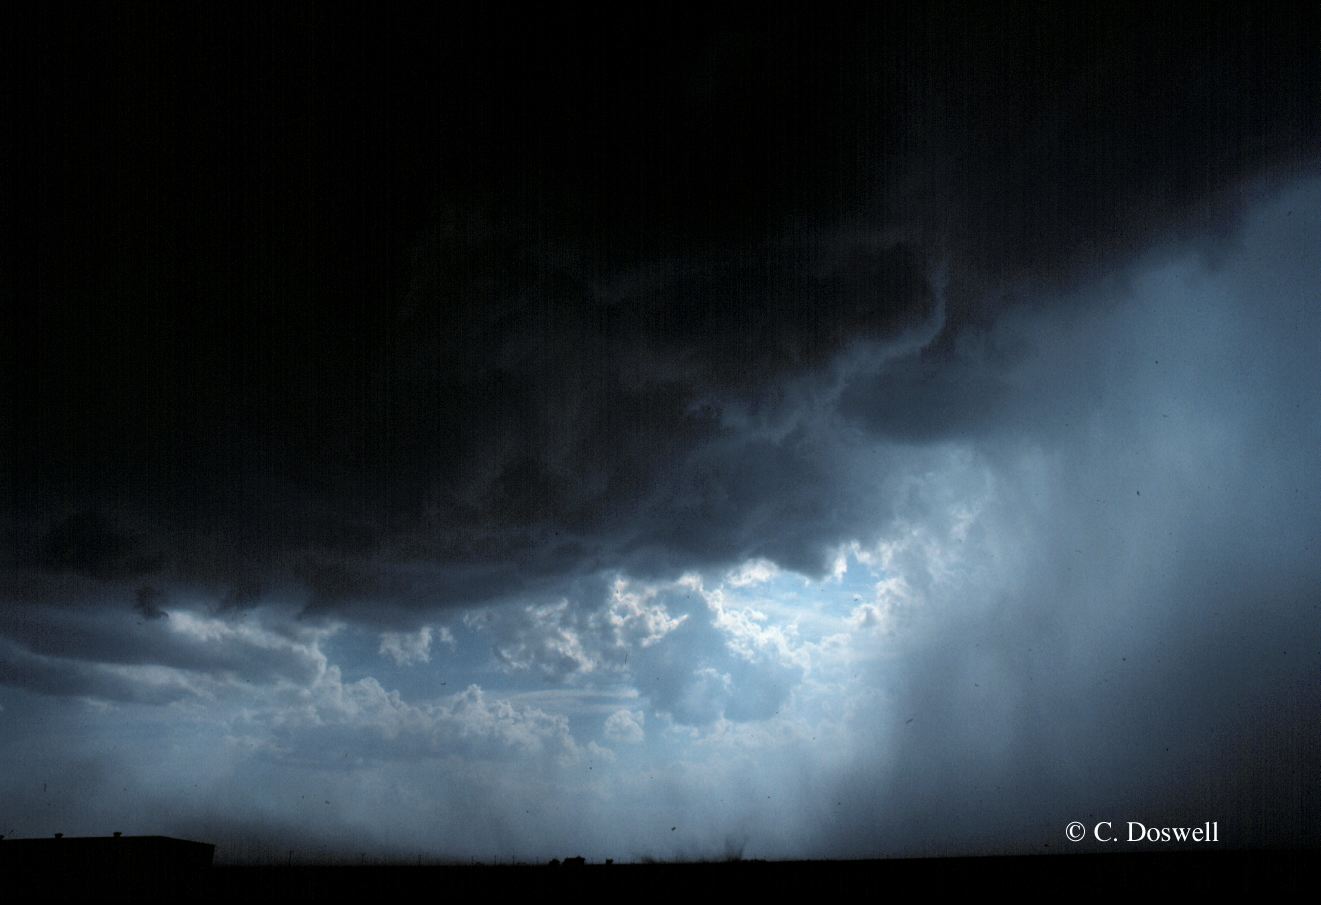
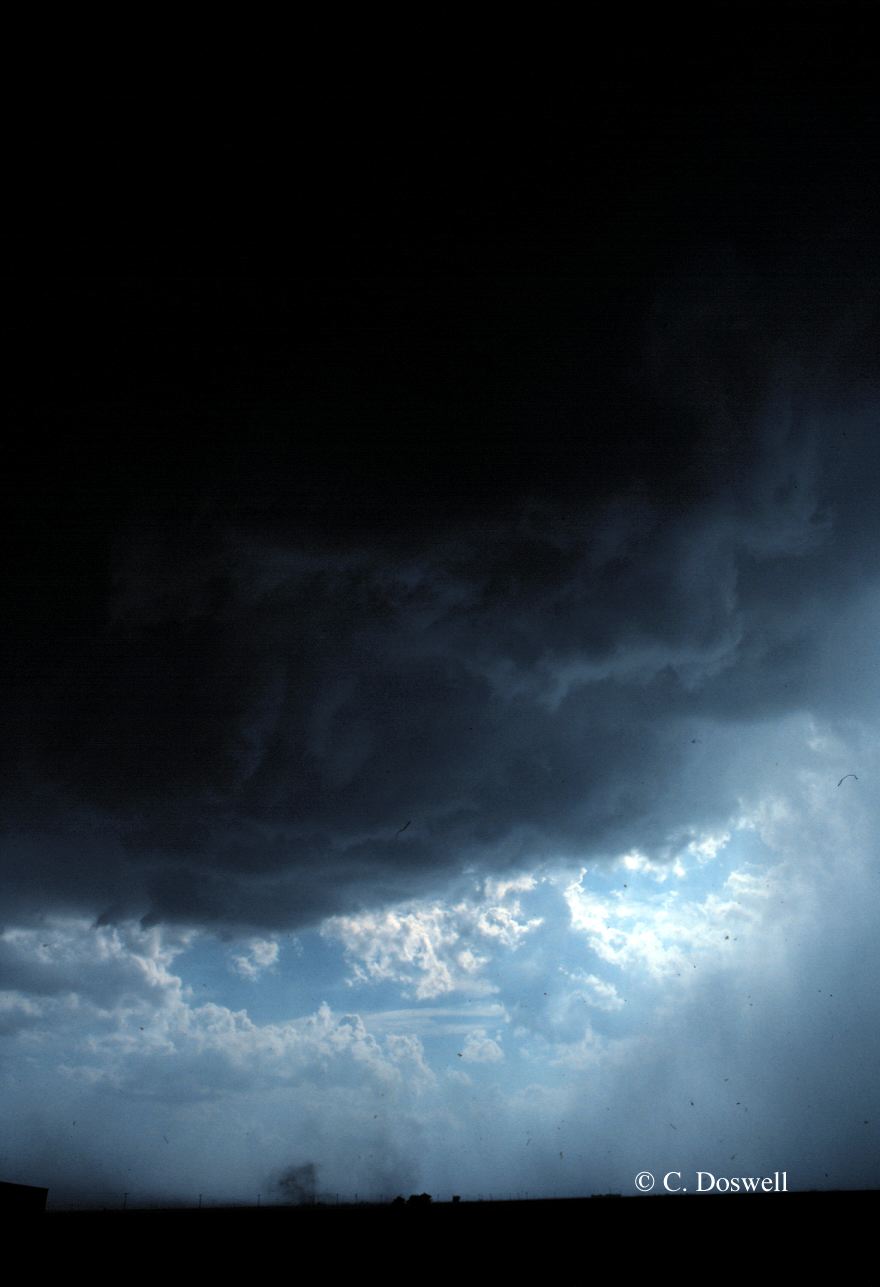
Low-based clouds also produce heavy rain with foot-shaped evidence of an embedded microburst. The scenes in Fig. 21 show precipitation blowing well under the rain-free cloud base (Fig. 21a) where the wind is picking up a curl of dust from a plowed field. Subsequently the dust plume is carried off to the left of the picture (Fig. 21b) as the rain shaft advances to the left. Note that the rain shaft is most opaque near the ground. A strong downdraft conveys rain toward the surface at a much faster rate than it can fall at terminal velocity through still air. As the downdraft approaches the ground it decelerates in the vertical, allowing a heavy load of water to accumulate above the ground. This results in an opaque low-lying base of the rain shaft (Fig. 21b). A descending wet microburst may first appear as a darkened mass of rain descending through light rain. For example, Fig. 22 shows a descending, high-density globular mass of rain (Fig. 22a), and a clearing out of precipitation in its wake (Fig. 22b). Such a globular mass of rain is one visual indicator of a potential microburst.
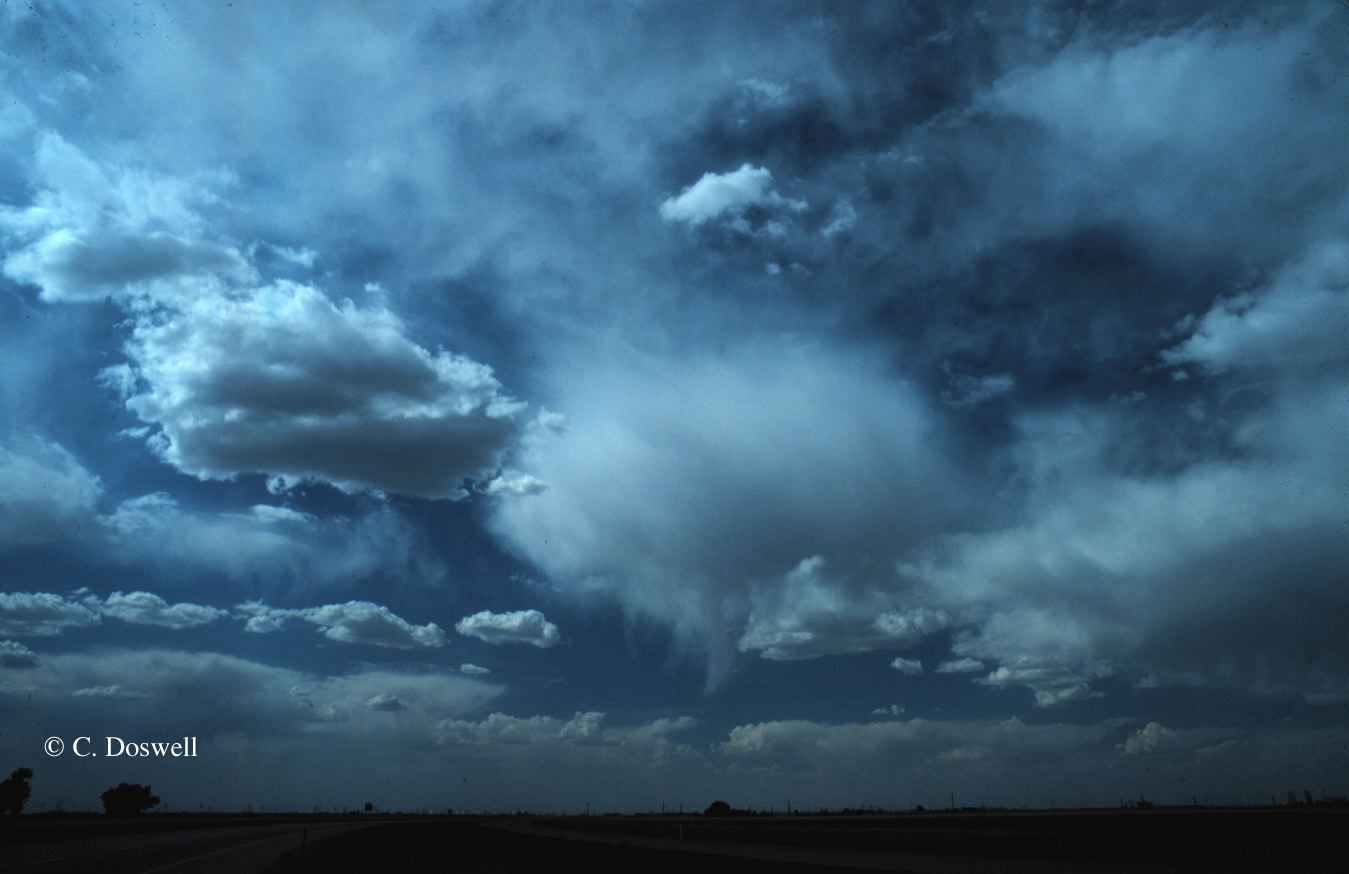
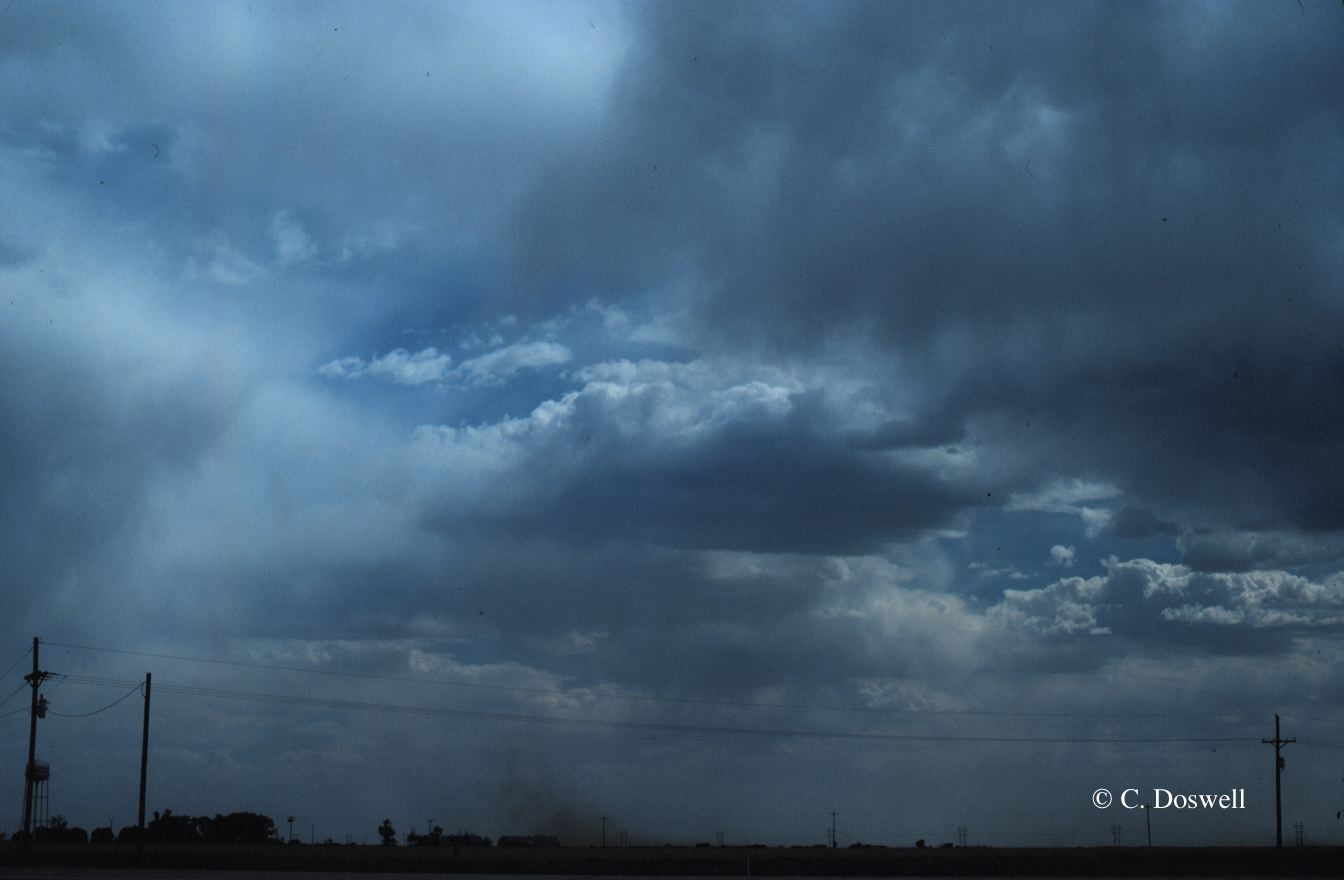
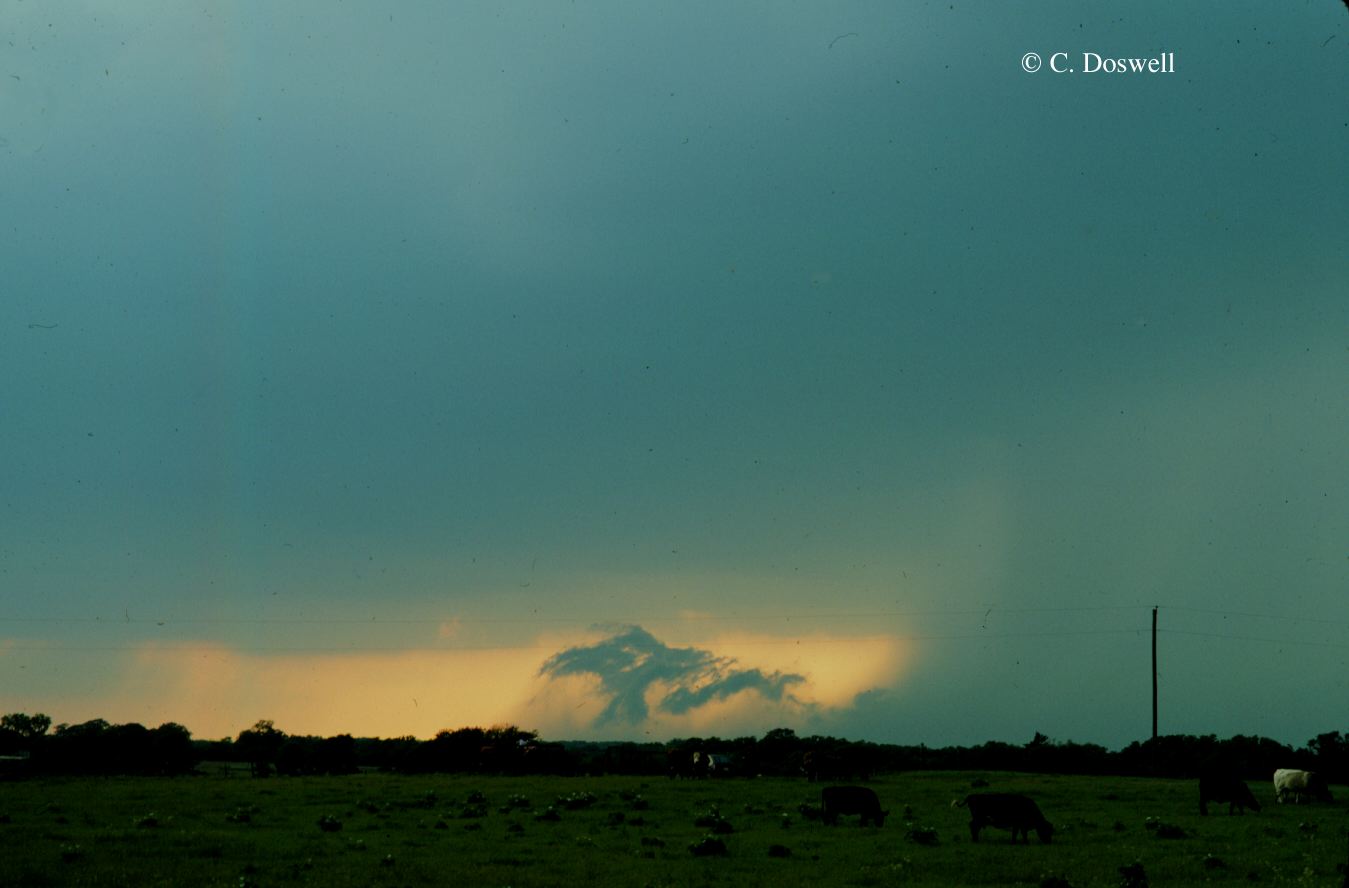
A storm with moderate to heavy rain is also a potential source of wet microbursts. In Fig. 23, for example, the telltale sign of an embedded microburst (or perhaps a larger scale downburst) is a curved plume of dust that is raised over dry ground ahead of the shower (Fig. 23a, center bottom) and grows rapidly (Fig. 23b). In wetter conditions, however, the soil may not be dry enough to furnish this visible clue, and instead a spray of raindrops may delineate the microburst. Such evidence is furnished by the spray of raindrops visible in Fig. 24. However, the maturing cell has a low cloud base, and tall vertical development, which suggests a localized downdraft rather than a gust front. The rain shaft leans outward under a lowered portion of the rain-free cloud base where a plume of either light dust or rain spray outlines swirling outflow that cloud strengthen into a microburst. The situation is much clearer in Fig. 25 and Fig. 26 where the outrush of strong winds near the surface produces a well-defined foot shape at the bottom of the rain shaft.
c. Difficult cases
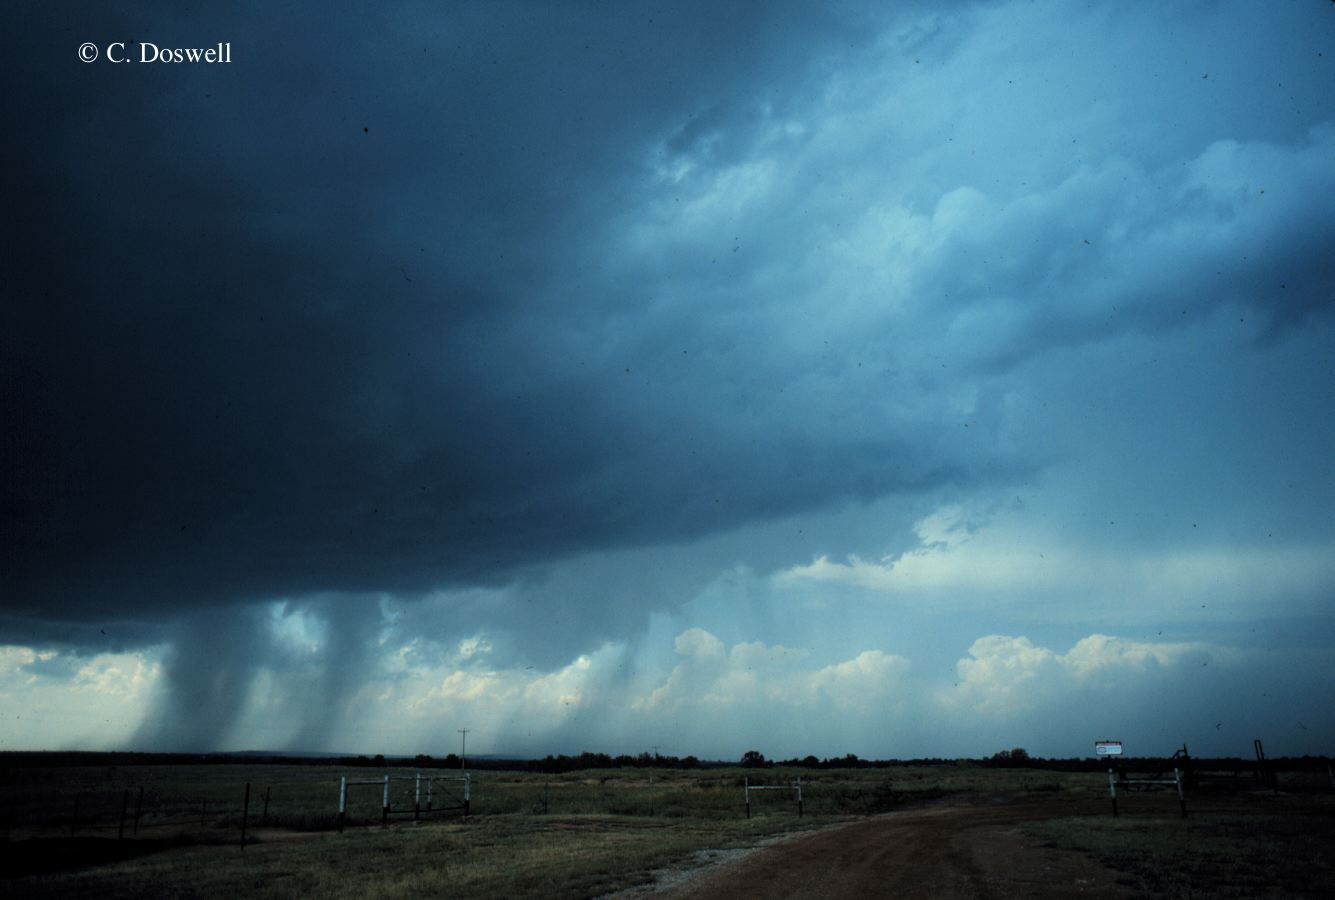
Sometimes it is very difficult to recognize the presence of microbursts. For example, the narrow rain shafts in Fig. 27 look normal at first glance, but closer inspection reveals what appear to be upward curls near the surface. Upward curls on the edges of narrow rain shafts may be indicating embedded microbursts with vortex circulations that carry a spray of raindrops back up toward the cloud.
The casual observer would expect dry microbursts to occur in arid or semi-arid portions of the country, and wet microbursts in humid areas. In addition, results of field experiments such as JAWS indicate that microbursts are normally midafternoon, midsummer phenomena. However, there are exceptions. For example, dry microbursts from high-based convection have been observed (Smith 1986) near Wichita, Kansas, and near Chicago ( Fujita 1985; both humid areas), and wet microbursts have been observed in arid Tucson, Arizona. The Tucson microburst was also exceptional because it occurred at night. The Tucson microburst and a typical midafternoon wet microburst in Wichita are compared in Figs. 28 and 29. Both have the characteristic precipitation curl tracing out the vortex-ring circulation that surrounds the concentrated downdraft within the rain shaft, indicating that no matter when they occur, dynamically they are the same beast and just as deadly.
In any part of the country there is some statistical mix of wet and dry microbursts at a distribution of time and season that extends beyond the normal range. Therefore observers should not reject an observation of a microburst because of its timing or because it may be an exotic type. Wherever and whenever it occurs, and regardless of its type, a microburst can cause an airplane crash, and should be taken seriously.
Babcock, M.R., and K.K. Droegemeier, 1989: Numerical simulation of microbursts: Aircraft trajectory studies. Preprints, 3rd Conference on the Aviation Weather System. American Meteorological Society, Boston, 62-67.
Batchelor, G.K., 1970: An Introduction to Fluid Dynamics. Cambridge Univ. Press, London, 615 pp.
Bedard, A.J., Jr., 1984: Optimizing the use of surface sensors for wind shear detection. J. Aircraft, 21, No. 12, 971-977.
______, S.J. Caplan, and C.A. Morroni, 1987: Microburst vorticity. AIAA 25th Aerospace Sciences Meeting, Paper AIAA-87-0440.
Braham, R.R., Jr., 1952: The water and energy budgets of the thunderstorm and their relation to thunderstorm development. J. Meteor., 9, 227-242.
Brown, J.M., K.R. Knupp, and F. Caracena, 1982: Destructive winds from shallow high-based cumulonimbi. Preprints, Twelfth Conference on Severe Local Storms. American Meteorological Society, Boston, 272-275.
Byers, H.R., and R.R. Braham, Jr., 1949: The Thunderstorm. U.S. Govt. Printing Off., Washington, D.C., 297 pp.
Caracena, F., 1976: Weather Analysis. National Transportation Safety Board Exhibit No. 5E-1 of Stapleton accident. Washington, D.C., 12 pp.
______, 1982: Is the microburst a large vortex ring imbedded in a thunderstorm downdraft? (abstract only). EOS Trans. Amer. Geophys. Union, 63, p. 89.
______, 1987: The microburst as an aircraft hazard and forecast problem. Bull. World Meteor. Org., 36, 278-284.
______, and J.A. Flueck, 1987a: Forecasting and classifying dry microburst activity in the Denver area subjectively and objectively. AIAA 25th Aerospace Sciences Meeting. Paper AIAA-87-0443.
______, and ______, 1987b: The classification and prediction of small-scale windshear events in a dry environment. Aerospace Century XXI, Vol. 64: Advances in Aeronautical Science, Ed. by G.W. Morgenthaler, G.L. May, W.K. Tobiska, and J.N. Koster, 1349-1360.
______, and ______, 1988: Classifying and forecasting microburst activity in the Denver area. J. Aircraft, 25, 525-530.
______, and M.W. Maier, 1987: Analysis of a microburst in the FACE meteorological mesonetwork in South Florida. Mon. Wea. Rev., 115, 969-985.
______, R.A. Maddox, J.F.W. Purdom, J.F. Weaver, and R.N. Greene, 1983: Multiscale analysis of meteorological conditions affecting Pan American World Airways flight 759. NOAA Tech. Memo. ERL ESG-2 [NTIS No. PB83-222562], 45 pp.
______, R. Ortiz, and J.A. Augustine, 1986: The crash of Delta flight 191 at Dallas-Fort Worth International Airport on 2 August 1985: Multiscale analysis of weather conditions. NOAA Tech Report ERL 430-ESG 2 [NTIS No. PB87-183455/GAR], 33 pp.
Charba, J., 1974: Application of gravity current model to analysis of squall-line gust front. Mon. Wea. Rev., 102, 140-156.
Didden, N., and C.-M. Ho, 1985: Unsteady separation in a boundary layer produced by an impinging jet. J. Fluid Mech., 160, 235-256.
Foster, D.S. 1958: Thunderstorm gusts compared with computed downdraft speeds. Mon. Wea. Rev., 86, 91-94.
Fujita, T.T., 1963: Analytical mesometeorology: A review. Meteor. Monogr., 5, No. 27, American Meteorological Society, Boston, 77-125.
______, 1976: Spearhead echo and downburst near the approach end of a John F. Kennedy Airport runway, New York City. SMRP Res. Paper No. 137 [NTIS No. N76-2184/1GI], Univ. of Chicago, 51 pp.
______, 1978: Manual of downburst identification for project NIMROD. SMRP Res. Paper No. 156 [NTIS No. N78-30771/7GI], Univ. of Chicago, 104 pp.
______, 1983: Microburst wind shear at New Orleans International Airport, Kenner, Louisiana, on July 9, 1982. SMRP Res. Paper No. 199, Univ. of Chicago, 39 pp.
______, 1985: The downburst, microburst, and macroburst. SMRP Res. Paper No. 210 [NTIS No. PB85-148880], Univ. of Chicago, 122 pp.
______, 1986: DFW microburst on August 2, 1985. SMRP Res. Paper No. 217 [NTIS No. PB86-131638], Univ. of Chicago, 155 pp.
______, and H.R. Byers, 1977: Spearhead echo and downbursts in the crash of an airliner. Mon. Wea. Rev., 105, 1292-146.
______, and F. Caracena, 1977: An analysis of three weather-related accidents. Bull. Amer. Meteor. Soc., 58, 1164-1181.
Hall, F.F., Jr., W.D. Neff, and T.V. Frazier, 1976: Wind shear observations in thunderstorm density currents. Nature, 267, 408-411.
Krumm, W.R., 1954: On the cause of downdrafts from dry thunderstorms over the plateau area of the United States. Bull. Amer. Meteor. Soc., 35, 122-126.
Smith, M., 1986: Visual observations of Kansas downbursts and their relation to aviation weather observations. Mon. Wea. Rev., 114, 1612-1616.
Sohl, C.J., W.L. Read, J.L. Branick, J.C. Lowery, and C.P Jansen, 1987: Observed microbursts in the NWS Southern Region during 1986; Four case studies. NOAA Tech. Memo. NWS SR-121 [NTIS No. PB87-180204/XAB], 45 pp.
Srivastava, R.C., 1985: A simple model of evaporatively driven downdraft: Application to microburst downdraft. J. Atmos. Sci., 42, 1004-1023.
Stewart, O., 1958: Danger in the Air. Philosophical Library, Inc., New York, N.Y.
Wakimoto, R.M., 1985: Forecasting dry microburst activity over the high plains. Mon. Wea. Rev., 113, 1131-1143.
Wilson, J.W., R.D. Roberts, C. Kessinger, and J. McCarthy, 1984: Microburst wind structure and evaluation of Doppler radar for airport wind shear detection. J. Climate Appl. Meteor., 23, 898-915.
go to the Additions page
go to the Figure captions page
return to the Semi-Official Microburst Handbook Home Page