Images are all copyrighted, so please send me an email to: cdoswell@earthlink.net if you wish to use any of them. Also, send any comments and/or corrections to that email address.
This document is not intended to be a formal history, but a decidedly informal one. It isn't a truly scholarly work, but rather a personal perspective by a participant in one of the more exciting aspects of tornado research: scientific storm chasing. It's a recently updated version of a draft manuscript that has been sitting inactive in my files since the mid-1980s. The primary reason for that inactivity is my perception that it wouldn't be acceptable as a formal, referred scientific paper. I still believe so, and therefore have chosen to make it a Web page.
I make no claim that this is an objective, fair treatment of the history - far from it. Rather, this is my personal perspective, heavily laden with my own personal biases and narrow viewpoints. Use appropriately...
Tornadoes are infrequent at any one place, have short lifetimes (on the order of a few minutes, generally), and affect only small areas during their usually brief existence. Within their paths, however, they can be extremely destructive; at their highest intensities, tornadoes produce the strongest winds on Earth. Thus, tornadoes generally haven't been subjected to thorough quantitative measurement - much remains to be known about them. This lack of observational data has hindered the validation of hypotheses concerning tornadoes (Lilly 1969; Morton 1966; Davies-Jones et al. 2001) Almost all of the data on the scale of the tornado itself have been gathered from limited sources: photogrammetric analysis of tornado film and videotape, engineering analysis based on damage surveys, and more recently, mobile radars. In situ instrumentation generally does not survive well in tornadoes.
Two early studies stand out in the early attempts at scientific analysis of visual (still and motion picture film) documentation of tornadoes. The works of Hoecker et al (1960) - studying the Dallas, TX tornado of 20 April 1957, and of Fujita (1960) - studying the Fargo, ND area tornadoes of 20 June 1957. These studies established many concepts and techniques for tornado research to follow.
Hoecker et al. used the extensive still and motion picture film documentation of the Dallas tornado to reveal not only the wind field in and near the tornado by photogrammetric analysis of debris trajectories, but also helped to locate the tornado with respect to the parent thunderstorm.
Fujita’s detailed analysis of the still and motion picture film of the Fargo tornadoes used many of the same techniques employed by Hoecker et al., but included an extensive analysis of the visual structure of the parent thunderstorm, as well as the tornadoes it produced. Much of the modern terminology of supercell convection originated with this study, including: wall cloud, collar cloud, and tail cloud (see the Appendix, below). The idea of a “family” of tornadoes from the same storm also was clearly documented with the Fargo storm case.
Lilly (1976) described the tornado as "perhaps the last frontier in tropospheric meteorology - the only intense and easily identifiable phenomenon whose internal structure and dynamics remain highly speculative." Although the situation has improved somewhat since Lilly made this statement, it is still more or less valid. At the time I returned to graduate school at the University of Oklahoma in the spring of 1972, the situation was that tornadoes and tornadic storms hadn't been subjected to systematic study by meteorologists. Eyewitnesses were typically untrained lay observers and only occasionally, mostly by accident, were tornadoes observed by meteorologists. When these lay observers recorded the event on still and motion picture film, it was possible to do Hoecker-Fujita type photogrammetric studies, but cases with extensive film documentation were quite rare.
Ward (1961) and Donaldson et al. (1965) were among the first to document successful tornado intercepts by ground vehicles. Bates (1962; 1963) had intercepted tornadoes using aircraft. These scientists did not routinely go to the field to intercept tornadoes and did not obtain high-quality documentation of their observations. Mobile ground teams had been used to pursue hailstorms (Browning et al. 1968) or to study the sequence of events as an updraft passed over them (Auer and Marwitz 1972).
Neil Ward truly was a pioneer of scientific storm chasing. In 1961, he intentionally chased and observed a series of four tornadoes occurring in association with a convective storm along a cyclonic shear line between inflowing warm, moist air from the south and the parent storm’s rain-cooled outflow from the north. Very little cloud-to-ground (CG) lightning was seen in the immediate vicinity of the tornadoes, although there was frequent lightning in the heavy rain cascade to their north. Ward’s observations were incorporated in a descriptive thunderstorm model by Browning and Donaldson (1963).
Fred Bates' airborne observations (Bates 1962; 1963, 1967) showed that tornadoes could form from cumuliform clouds on the flanks of the main thunderstorm - that is, the so-called flanking line convection (see the Appendix, below). Bates attached great importance to the flanking line convection, a subject discussed further in section 3.c, below. Bates summarized his observations as follows:
Bates pointed out that flanking line tornadoes (which he defined as Class I) are not generally as long-lived as those that form from a rotating cumulonimbus (i.e., supercells with mesocyclones - Class II). However, a Class I tornado might evolve into a Class II as its parent cloud develops into a cumulonimbus. Bates believed that Class I tornadoes are much more common than Class II tornadoes. However, this perception is likely as sampling bias resulting from his intercept technique of flying along the flanks of thunderstorms. His two-class scheme, however, anticipated a similar scheme used by Davies-Jones et al. (2001).
Storm chasing by lay persons was unknown to research at the time of the early 1970s, although some chase pioneers (notably Roger Jensen and Dave Hoadley) had been doing so with varying degrees of success for quite some time. It was only years later that we became aware of their activities - notably in 1977, when Dave attended the AMS Severe Storms Conference in Omaha, NE.
By some coincidence, it turned out that a number of people interested in storm chasing all arrived in Norman, OK in the spring of 1972. I had been separated from active duty military service in February and was in the process of returning to my Ph.D. studies at the University of Oklahoma (OU), under the mentorship of Prof. Yoshikazu Sasaki. Joseph Golden was completing his doctoral studies on waterspouts and working at the National Severe Storms Laboratory. During his waterspout work, Golden had made use of aircraft to intercept waterspouts, and had developed a conceptual life-cycle model (Golden 1974). Golden was interested in developing a project to intercept tornadoes in order to obtain high-quality movie footage of the debris, in order to determine the maximum windspeeds in tornadoes. This project also included an Engineering faculty member from Notre Dame University, Prof. Bruce Morgan, who had envisioned intercepting tornadoes with a heavy armored vehicle (basically, a tank). Dr. Robert P. Davies-Jones, a meteorologist working at the National Severe Storms Laboratory (NSSL) was interested in obtaining data to validate some of his theoretical work involving tornadoes. Several OU students wanted to participate in this project (myself, Al Moller, Steve Tegtmeier, Gordon Gerber, and others), and our participation was agreed to by Prof. Sasaki, who supplied us with a 16 mm Bolex camera for documentation. See here for my early chase history. Joe Golden had secured the use of a 16 mm camera developed by NASA for documentation. The Tornado Intercept Project (TIP) was ready to go in early April of 1972, with the following goals
It is sadly ironic that the first TIP storm chases began on 18 April 1972, less than a week after the date when Neil Ward died.
3.1 Visual observations as a supplement to radar
Scientific knowledge of severe storm structure increased dramatically with the introduction of weather radar in the post-WWII era, and with the routine use of Doppler radar in research in the early 1970s. A multiple-Doppler radar array is undoubtedly a magnificent sensor for severe thunderstorms because of its ability to provide 3-dimensional maps of the wind and precipitation fields within deep convective storms. However, even Doppler radars have their limitations. Spatial resolution decreases with increasing range from the radar transmitter/receiver owing to beam spreading. Only those parts of a storm with radar-detectable particles will be sensed by the radar - the detectability of particles is a function of the wavelength of the radar and the operational radars used by the National Weather Service use a 10 cm wavelength that does not detect cloud particles very well - only precipitation-sized particles are reliably detected at 10 cm wavelengths. The curvature of the Earth means that as range increases, the beam at its lowest elevation angle cuts the storm at an increasingly high elevation - the height of the lowest features a radar can detect increases with range. Radars cannot measure thermodynamic properties (pressure, temperature, humidity). Measuring the vertical component of air motion accurately with a Doppler radar is rather problematic (unless the beam is pointed vertically), which is complicated by the terminal velocity of the particles detected by the radar. And so on.
Having trained eyes in the field can provide information that no radar alone can observe. Moving images (film and/or video) provide information complementary to that offered by radar; whereas a single Doppler radar detects only the radial component of motion, film/video provide information only about the transverse component of motion. Features at and below cloud base (wall clouds, shelf clouds, tornadoes, etc.) can be observed by field spotters but not typically by a radar. Field observations also can provide a connection between various cloud features (as documented in moving and still images) and the precipitation (which can be observed by radar - at least above cloud base). Falling hydrometeors (rain, hail, and others) can be sampled and related to the radar observations.
3.2 Personnel and equipment
At the inception of TIP, the formal field teams consisted of a team leader and three members. The team leader had the final word on all in-vehicle decisions and was considered responsible for team safety and performance of the team duties. The team leader also chose the intercept route - based on the availability of roads, visual storm observations and information received from the operations base. Team members were assigned to various duties: driving, documentation, photography, and navigation. An emphasis was put on accurate, detailed entries of time and location for all observations on a log (typically a portable tape recorder). A large van with windows on all sides is the best type of vehicle, offering good visibility and ample room for equipment. Items typically carried by the field teams included: maps, tape recorders, an insulated chest with dry ice (for hail collection, if presented with the opportunity), 16 mm movie cameras, 35 mm slide cameras, intervalometers (for time lapse movies), and other photographic accessories and supplies. Each van was equipped with an FM two-way radio and a radio telephone (this was at a time well before cell phones). FM communication with base (typically, NSSL) was routed through a repeater located at the 440 m level on a television tower 40 km north of NSSL. Beyond the FM system range (115 km from the repeater), the radio telephone was used if possible. Otherwise, public telephones were used. Teams also used a second, short-range FM two-way radio for intervehicular communication.
The project "Nowcaster" operated from NSSL - the first Nowcaster (Don Burgess of NSSL) had a role in the 1972 intercept project that was more informally than formally defined. His duties eventually came to include: preparation of a 0-9 h forecast by 1000 CST and monitoring the weather continuously during field operations. In addition to a project briefing held each operational day at 1000 CST, the Nowcaster relayed the latest synoptic and mesoscale information to the field teams, and incorporated their observations into the developing diagnosis of ongoing weather. When storms developed, the Nowcaster would direct the teams toward the most promising storms based on radar (and, to a lesser extent, on satellite) observations. Field observations of tornadoes, wind, and hail were relayed to the National Weather Service by the Nowcaster and to the Doppler radar meteorologists operating at NSSL, while information regarding echo positions, storm motions, storm structure, and Doppler radar signatures of mesocyclones and tornadoes flowed out to the field teams. Some years, the Nowcaster served as many as six field teams - four from NSSL and the University of Oklahoma, and two “visiting” field teams from other institutions.
3.3 TIP History
Bruce J. Morgan, at the time a Notre Dame faculty member, provided the impetus for initiating the project by proposing ground intercepts of tornadoes using a flatbed trailer and an armored, tracked vehicle. The vehicle was to be carried aboard the trailer to near a developing tornado, and then deployed and driven on an intercept course through the tornado. Instruments on the vehicle would measure meteorological variables. NSSL decided to fund the project on a limited, trial basis (sans the tank) to assess the feasibility of having mobile teams getting to within visual range of a tornado. This goal was achieved first on 30 April 1972 (Golden and Morgan 1972), despite a dearth of tornadoes that year. The idea of driving an armored vehicle through the tornado was quietly dropped owing to a number of troubling issues (bridges on many Oklahoma roads not being able to bear the weight of such a vehicle, uncertainty about the survivability of such an encounter, and possible lawsuits from landowners after an armored vehicle traveled over their land).
In 1972, the first year of TIP, the project resources were quite limited and the team had to develop strategy and tactics without the benefit of any prior experience. As time passed, storm intercept teams evolved into a routine part of NSSL’s and OU’s spring observational programs. Annual spring observational programs ended after the mid-1980s, to be replaced by ad hoc program planning. including the occasional major field program (e.g., VORTEX), all aimed at some specific scientific objectives. Storm intercept teams have continued to be a part of such programs.
3.4 TIP Tactics
To maximize intercept chances, the teams must get underway well before deep convection is initiated. On each potential operational day, the team status had to be evaluated. Depending on the weather situation at the time of the 1000 CST forecast, a decision had to be made to:
Based on the input from the Nowcaster, as well as the operational status of the teams, the team leaders would make these decisions. Obviously, a team’s operational status might change several times during an operational day.
Once storms developed, the team strategy was based on the feasibility of an intercept of a storm likely to be tornadic. Unless a decision was made to ignore existing storms in favor of anticipated new developments, a target storm would be chosen based on information available to the field teams and the Nowcaster. From that point, the goal would be to maneuver into the best position to observe any tornadoes, usually somewhere on the inflow side of the storms. It soon was learned that driving through a storm’s precipitation core was undesirable from a number of standpoints, so avoiding storm cores was an important part of formulating intercept tactics.
As the storm was approached, the field team’s visual observations became more important. Relayed radar information was decreasingly relevant except perhaps regarding the status of the storm’s tornado potential. This was a fortunate circumstance because near-storm communication with the Nowcaster was often unreliable. The crews became experienced at recognizing relevant cloud features for assessing tornado potential, picking out the likely location of any developing tornadoes, and identifying visual precursors of tornadoes. Once a tornado had been spotted, the team would try to position itself ahead of and to the right of an anticipated tornado track. This would also entail identifying an escape route if the tornado began to move directly toward them. A vantage point ahead of and to the right of a tornado’s path would generally offer the best visibility and contrast between the tornado and its background, with the least likelihood of intervening precipitation. Being behind a tornado not only can result in decreased visibility and contrast but tornado damage can result in blocked roads, terminating the chase prematurely. A notable early intercept was that of the so-called Union City tornado of 24 May 1973, documented in Brown et al. (1976) and Moller et al. (1974).
In 1973, rockets bearing chaff were launched near storms to introduce radar-detectable tracers into severe storm inflows. The University of Wyoming participated in TIP during the 1975 storm season by sharing their vehicles that were instrumented for measure of pressure, temperature, dewpoint temperature and other meteorological variables (see Martner 1977). NSSL purchased this and other instrumented vehicles from the University of Wyoming for TIP use in 1978. These were forerunners of the instrumented vehicles deployed during the VORTEX project (Rasmussen et al. 1994).
It was anticipated in the 1970s that mobile radars (and lidars) could be developed for storm intercept operations, as well as instrumented, remotely-piloted aircraft and instrumented rockets, carried on airborne platforms for firing into tornadoes. Most of these have become reality in subsequent years (see e.g., Rasmussen et al. 1994), although the use of instrumented rockets for tornado penetration has never been successful and has been abandoned, at least for the time being.
3.5 Prospects for TIP success
Because the TIP crews guide themselves primarily visually during the final stages of a storm intercept, the chances for a successful intercept are closely tied to the local topography. Tall, dense vegetation, populated areas, hilly terrain, and locally poor visibility are all major hindrances to a successful intercept, to say nothing of the availability of roads. For maximum success, the region should have little or no terrain relief, with no large lakes or rivers (limited crossing points), little or no vegetation beyond grass, low population density, and a dense network of roads. The extant weather conditions are also important: the presence of haze, low overcast, or extensive precipitation are also hindrances to successful intercepts. Fortunately, in some regions of the Plains, near-ideal chasing conditions can be found frequently. Specific regions with outstanding chase conditions include western Texas between Amarillo and Lubbock, or southeastern South Dakota.
During the early years of TIP operation in Oklahoma, TIP teams were sent out on about 25% of the days during the two month period of operations (typically 15 April - 15 June). This period of operation was basically what the NSSL resources allowed, including operation of a (fixed) mesonet, supplemental soundings, engineering for radar maintenance, etc. A field team permitted to range from 240-320 km from base typically had a successful chase (i.e., observed one or more tornadoes) roughly one day out of seven chase days in the 1970s and early 1980s. The high percentage of days without observing tornadoes is a combination of deficiencies in tornado forecasting skill, and the difficulty of storm intercepts. Since tornadoes are rare events and can occur on days when extant understanding seemed to make tornadoes unlikely, teams were usually sent out even when the chances of seeing a tornado were not considered to be high. Note that useful scientific data can be collected on an “unsuccessful” chase day - collecting data on nontornadic events could be useful for comparison with data collected on chase days with tornadoes, although nontornadic chases of the period were generally not selected for study.
Tornadoes in Oklahoma occur before 1300 CST less than 10% of the time. After 1900 CST, the availability of daytime light becomes problematic (depending on the date, of course). Tornadoes that occur within 240 km of Norman, OK between the hours of 1300-1900 CST are considered "chaseable"). The climatological frequency of chaseable tornadoes in Oklahoma by this definition is 1-2 events per 10 000 km2 per two-month storm season. In an average season, there are 18 chaseable tornadoes and seven chaseable tornado days. In the period 1972-1977, about 1/5 of chaseable tornadoes were actually observed by field teams (including formal TIP teams and private chasers).
3.6 Discussion
Since it was difficult to chase a storm from its very beginnings to its eventual demise, we developed subjective composite "models" of our observations from many different chases. This process of formulating conceptual models is unavoidably subjective and many of the characteristics we described were not rigorously documented or derived. It was true then and remains true that many concepts that are widely accepted among chasers are nearly unheard of in the formal scientific community. Some part of this empirical knowledge base is of dubious validity, but some other parts may comprise the first tentative observations leading to important new insights, Knowing which parts will stand up to rigorous validation in advance is not necessarily easy or obvious.
4.1 Introduction
Intercept strategy requires a forecast of the location and time of tornado occurrence, to the limit of the forecaster's ability. In the process of developing intercept strategy as discussed in Section 1.5, intercept personnel have had to develop tornado forecasting techniques, as well. This is not the document to detail the forecasting process, but it has been established (Miller 1972, Moller 1974, Tegtmeier 1974, Doswell 1977, Doswell et al. 1993, and others) that tornadoes occur in characteristic synoptic and subsynoptic-scale patterns. These patterns determine to a large extent the general disposition and intensity of thunderstorms. NWS forecasters can predict, with reasonable success, the likelihood of tornadoes within regions on the order of 105 km2 (Kessler 1970, Galway 1975, Pearson and Weiss 1979), up to several hours in advance. Over the years, there has been a slow increase in forecast accuracy (Doswell et al. 1993) that continues to the present.
4.2 Dynamics and thermodynamics
Severe storm forecasters have developed a number of approaches using parameters that can be grouped into two distinct categories: dynamic parameters and thermodynamic parameters (Miller 1972; Johns and Doswell 1992). Strictly speaking, this distinction is not a valid one: thermodynamics is not a body of knowledge that can be separated from dynamics. As used here, the notion of "thermodynamic" parameters is one that is based primarily on temperature and moisture variables (e.g., most standard convective indices, lapse rates, etc.), whereas "dynamic" parameters are those related to the presence of powerful extratropical cyclones (e.g., cyclonic vorticity advection, vertical wind shear, etc.). The relative importance of the two has been debated (Newton 1963, Doswell 1987) but never resolved - arguably because it's not a meaningful issue: the topics of "dynamics" and "thermodynamics" are inextricably linked.
Anyway, my perception is that many NWS forecasters, including those at the Storm Prediction Center (SPC) historically have had a "dynamics" bias - they're heavily influenced by forecasts of intense extratropical cyclones to forecast severe weather, without paying as much attention to such parameters as lapse rate, low-level moisture, etc. Although I can’t speak to what might influence their choice to be biased toward strong synoptic-scale systems, it seems to me that many such forecasts fail to produce the anticipated severe weather events, whereas situations with weaker "dynamics" and stronger "thermodynamics" produce unanticipated amounts of severe weather. In recent times, this bias seems to be disappearing.
It's clear that the presence of potential buoyancy (as measured by CAPE, or the Lifted Index, for instance) is a virtual requirement for deep convection, so this would seemingly be one of the most important parameters. However, there are many studies suggesting that buoyancy by itself is poorly correlated to severe thunderstorm events (Davies and Johns 1993, Monteverdi et al. 2003; and others). Buoyancy is necessary but far from sufficient to produce severe convection and the degree of buoyancy seems not to be well related to the degree of severity of the storms.
I've argued elsewhere (Doswell 1987) that a primary role of synoptic-scale processes is to set up the ingredients for subsynoptic-scale events to develop into severe convective situations. Unfortunately, the dynamics of subsynoptic-scale processes are much less well understood than those of extratropical synoptic-scale processes. In the early 1970s, much research about the relationship between storms and their environment had not yet been done, The development of fully 3-dimensional numerical cloud models in the early 1970s has led to a revolution in our understanding of that relationship. In particular, the role of the importance of vertical wind shear, first advanced by Keith Browning (e.g., Browning and Ludlam 1962; Newton 1963, 1966) has been shown by those model simulations (Weisman and Klemp 1982, 1984). Curiously, by coincidence, the first fully 3-dimensional numerical simulations of supercells (Schlesinger 1975; Klemp and Wilhelmson 1978) were roughly contemporaneous with both the development of Doppler radar capability and the growth of scientific storm chasing. Together, these three developments (Doppler radar, numerical cloud modeling, and storm chasing) have changed our understanding of storms profoundly (Doswell 2001).
Chase forecasters soon had enough experience (and direct feedback from the fruits of storm chasing) to begin to formulate new ideas about the environments in which severe convective storms and, in particular, tornadic severe convective storms, are most likely. Some of these have already been cited, here. Those ideas formed the basis for the early years of scientific storm chase forecasting methods.
Traditional severe storm forecasting methods had been geared toward large-scale tornado outbreaks (as defined by Galway 1978), such as the famous 11 April (Palm Sunday) 1965 and 3-4 April 1974 outbreaks (Fujita et al. 1970; Fujita 1974). In such massive events, the dynamic and thermodynamic parameters are organized and clearly manifested on synoptic scales, such that the observing systems of that era were quire capable of delineating the event. These outbreaks have traditionally been reasonably well-forecasted (Ostby 1975; Pearson and Weiss 1979, Doswell et al. 1993) and so can be described as "synoptically evident."
However, most severe weather event days are not so easily diagnosed and forecast (see Maddox and Doswell 1982) - the challenge of forecasting a severe weather event increases as the time and space scales of the processes responsible for concatenating the ingredients decrease. The conventional surface network of the 1970s was helpful, nevertheless, in identifying potentially significant severe weather days. Chappell (1957), Whiting and Bailey (1957). Magor (1959), Maddox (1973) and others described methods by which surface observations could be helpful in anticipating events of lesser magnitude than a major outbreak. Early TIP experience led to the papers by Tegtmeier (1974), Moller (1974) and Doswell (1977a) in which several characteristic subsynoptic-scale patterns were identified as likely to produce tornadic events. Detection and tracking of subsynoptic-scale features in the standard surface data, either subjectively or objectively (Doswell 1977b) was a key contribution to the success of TIP forecasting efforts, when coupled with careful analysis of satellite imagery and radar observations.
It was recognized early in the TIP experience that the dryline was often a locus for the development of tornadic storms. This had been known for some time (e.g., Rhea 1966) but Tegtmeier specifically noted that a bulge in the dryline (denoted as DLB) was one subsynoptic-scale structure that indicated tornado potential. The other main subsynoptic-scale feature of significance was the so-called frontal wave (denoted FW), a subsynoptic-scale cyclone that might or might not go on to develop into a full-blown extratropical cyclone. The following represent some early TIP findings regarding these features:
Table 1 summarizes the observations from the first few years of TIP operations. Storm Data was used to find the relatively long-track tornadoes that represent the most chaseable events. Any storm originating on a dryline was included in the DLB category. It can be seen that the FW and DLB events are the majority of all such tornadoes.
|
|
|
|
|
|
|
|
|
|
|
|
|
|
|
|
|
|
|
|
|
|
|
|
|
|
|
|
|
|
|
|
|
|
|
|
|
|
|
|
|
|
|
|
|
|
|
|
|
|
|
|
|
|
|
|
|
|
|
|
|
|
|
|
|
|
|
|
|
|
|
|
Table 1. Number of tornadoes 1972-1976 with path lengths > 10 nautical miles within TX, OK, KS, and NE - associated with each subsynoptic weather pattern: FW = frontal wave, DLB = dryline bulge, FNT = front, SQLN = squall line. I believe this compilation to have been the work of my colleague, Alan R. Moller.
To some extent, these early observations by TIP forecasters have been validated by continuing experience.
Given the origins of most storm chasers in personal interest, nowcasting at the start of TIP was not very well organized or even considered to be a formal task as part of the NSSL spring observational program. As already noted, the task can be broken down into three components: making a morning forecast, coordinating the field teams, and vectoring the teams toward promising locations (and storms, once they get going). These components quickly came to be the responsibility of one person at NSSL. This was in an era when communication between vehicles would be very limited so the Nowcaster would be the primary channel for coordinating the whole intercept process.
Field operations were (and are) strongly dependent on the quality of the nowcasting. Ground vehicle response time is relatively slow and getting into position for a successful tornado intercept is not an easy task, often complicated by obstructions to the vision of field teams. Once vehicles were underway, it was easy to be mislead by what could be seen in the field. Having a Nowcaster to watch radar and satellite images for the intercept crews is a valuable safety net. The field teams can get uncomfortable when they are waiting for something to happen, and can imagine all sorts of negative scenarios associated with sitting still. The psychology of chasing means that waiting is fraught with anxiety, but in many cases, leaving a position that looked favorable in the morning often proves to be a mistake. I call this anxiety that often develops in storm intercept teams "afternoon angst"- having a Nowcaster to reassure the teams that everything is still going well can be a major advantage. And, of course, at times, it indeed becomes necessary to change the target area as the meteorological situation evolves. Obtaining information prior to the modern Internet era was only possible by communicating with someone who had access to weather data.
The Nowcaster would be involved in the whole operation from start to finish, and so might spend up to 18 h a day doing weather analysis and diagnosis for several days in a row, depending on the situation. In May of 1977, the teams went out seven days consecutively, an episode that came to be known among the participants as "Seven Days in May" after the movie of the same name. This can induce considerable fatigue, naturally. The evolution of the Nowcaster role can be seen in the annual Spring program summaries begun in 1974 (e.g., Barnes 1974; Wilk et al. 1976; Alberty et al. 1977). Progress in this evolution is necessarily based in part on previous failures and deficiencies, as well as experience gained during the process.
6.1. The morning forecast
Much of the morning routine for the Nowcaster follows basic principles first documented in Miller (1972) and which have been evolving ever since (see Johns and Doswell 1992; Moller 2001). However, the focused nature of the TIP operations, taking place in a relatively limited area, means the nowcaster can focus attention on the possibilities within one day’s driving distance from Norman, OK. This also is not too different from a radar’s useable range. Given the basic synoptic-scale situation, which can be diagnosed relatively quickly, the main issue was (and continues to be) subsynoptic-scale processes.
If the metric of success is the interception of a tornado, then the success rate of forecasts is rather low. In the early years of chasing, it was unclear how to recognize tornado potential, so chases were planned on most any day with even marginal tornado potential - to the best of the forecaster’s ability to recognize that potential. Success depended on the subsynoptic and mesoscale details that were, for the most part, unforecastable except with regard to the foregoing subsynoptic scale features that had come to be recognized as relatively common features. This remains more or less true today, although we want to believe we've become better at the forecasting aspect of the chase process as new observations and new methods (heavily based on NWP models, of course) have come into operational practice.
Despite the receipt of new data through the day, it's often the case that the careful analysis and diagnosis of the morning represents the best forecast. It often has proven a mistake to be swayed by hourly observations too readily, unless they signaled an anticipated evolution. It's common to find oneself bouncing between different forecasts as new data come in. When operating in the field, this often results in wasted attempts to respond to the new data, when subsequent events prove that the initial forecast was more or less correct. It can be difficult to abandon one's first forecast, and it usually turns out that such a conservative approach is actually best, unless confronted with overwhelming evidence. The aforementioned "afternoon angst" is often a cause for field teams to abandon a perfectly good starting point in favor of what is on the horizon. Hence, the Nowcaster is probably best serving the needs of the field teams when standing by his or her original forecast until events compel a change.
When field teams begin deploying, the Nowcaster duties shift primarily toward hourly assessments and vectoring the field teams to the most likely storms, after storms begin. Thus, the Nowcaster's morning assessment is of critical importance and must be done quickly, as the time between the receipt of data from the 12Z soundings and the morning briefing is not very long. Typically, surface and mandatory pressure level charts at 850, 700, 500, and 250 mb are analyzed, as well as the OKC, AMA, DDC, TOP, and SEP soundings, looking for thermal and moisture boundaries, regions of convective instability, moisture depth, shortwave troughs, jet streaks, and so forth. Satellite data (at first only in hard copy form) were recognized early to be an important supplement to more conventional observations (Siebers et al, 1975). Numerical model prognoses are consulted only after a careful diagnosis of the morning data. This permits an unbiased look at the data first, and then any evolutions suggested by the resulting diagnosis can be considered in light of the model forecasts.
6.2 The afternoon nowcasts
Whatever the forecast, the Nowcaster is expected to monitor the weather for the rest of the day. When field operations are underway, this is necessary for the success of those field operations. If operations are not initiated soon after the morning briefing, then depending on the status of operations (which may be on hold or which may have been formally suspended for the day), the Nowcaster is either seeking to assist the decision-making process by continuing meteorological assessments, or is simply staying in touch with what the atmosphere is doing. This latter task allows for the possibility of operations if something unanticipated begins to develop, and also permits the Nowcaster simply to improve his/her sense of awareness of atmospheric processes.
When field operations are underway, the Nowcaster not only relays meteorological information to them, but also can pass on reports of severe weather from the field teams back to the National Weather Service. The Nowcaster is not only responsible for helping the field teams to intercept potentially tornadic storms, but also to keep them aware of developments they might not be able to see for themselves. Safety of field operations is always a high priority and so the Nowcaster is not simply coordinating the field operations, but is also committed to keeping them aware of storms developing nearby. Storm movement can be difficult to assess from the field, and this movement is critical for intercept tactics and for team safety, as well. The latter is even more important at the end of an intercept, when the teams are tired and on their way back to base. Storms do not necessarily cease to be dangerous at the end of a chase, so the Nowcaster has to maintain contact with the field teams on their return trip, as well, to prevent their being caught in a hazardous situation.
At the beginning of TIP, our knowledge of severe storm structure and evolution, as well as the location of the most severe forms of weather relative to the storms producing that weather, were quite limited. Apart from the case studies of Hoecker (1960) and Fujita (1960), and the observations of Bates (1963) and Donaldson et al. (1965), there was precious little to go on. It was simply not obvious how to extrapolate on the basis of the limited case study examples to apply the knowledge of research projects to intercept strategy and tactics. From the viewpoint of the present (2008), it's difficult to realize how little was known about severe storms, especially tornadic storms. Much of what we've come to understand of severe storms grew out of the science that developed in the wake of the experience gained by storm chasers. Chasers went out on more than just the big tornado outbreak days, and therefore began to accumulate experience with a wide range of convective storms that might have all looked more or less similar through the existing conventional data, and as viewed by geostationary satellites and conventional (i.e., non-Doppler) radar. The visual perspective would become coupled to the radar and satellite observations in a way that we may take for granted today, but which at the time was a revolutionary aspect of scientific storm chasing.
Browning's work on severe storms through the mid-1960s was clearly the most comprehensive and helpful (with Fujita's work close behind) - especially the notion of the supercell, for which Browning is largely responsible. This, coupled with the other early works, began to develop into a comprehensive understanding of supercells and their attendant severe weather, including tornadoes. Storm chasing established that squall lines were rather less likely to produce significant tornadoes than relatively isolated supercells. By seeing not just one or two cases, but rather having seen several supercells per chase season, the chase crews began to grasp not only the commonalities among all such storms, but also the features that were unique to particular storms.
7.1 Long-range observations
In the process of trying to sort out which storm to chase on a given operational day, certain visual cues have come to be recognized as important. Storms producing extensive anvils with sharply-defined edges are associated with powerful, persistent updrafts and so are most likely to be supercells. Weaker, less persistent updrafts produce anvil edges that are more diffuse and may also have more or less "scalloped" edges, indicative of relatively long time intervals between updraft "pulses".
Another observation of interest was that relatively small regions of enhanced convection early in the chase day would be tied to some mesoscale feature. These proved typically to be areas with sustained enhanced surface moisture flux convergence, perhaps northeast of a FW or DLB. The convective towers would remain coupled to the mesoscale feature, perhaps for several hours before deep convection got underway. That is, new convective towers would form repeatedly in the same general area associated with some mesoscale feature. The first indication of initial deep convective development would be the so-called "turkey towers" (so named because they resembled the heads of turkeys). After a period with turkey towers forming and dissipating, the main storm would be manifested as the "Fist of God" - a much larger and obviously more rapidly-ascending convective bubble than the turkey towers preceding it. This feature would then go on relatively rapidly to become a supercell on days when conditions were right, and that storm was no longer coupled to the mesoscale feature that initiated it. That is, once underway, a severe storm typically would begin to move away from the mesoscale feature within which it began.
Once a major storm is underway, its anvil spreads widely, as well as rapidly downstream in the typically strong winds aloft. Severe storm anvils quickly can overspread a large area. The anvil then shades the surface beneath it, often shutting down the ordinary cumulus activity beneath it. Strong storms seem to suppress surrounding storms, either by anvil shading or by compensating subsidence in their near environment. This allows a few strong storms to survive as relatively isolated supercells. The anvil divergence can cause anvil material to be spread even into the typically strong winds aloft. This spreading of the anvil into the winds aloft is clearly associated with powerful divergence at the anvil level, and results in the development of the so-called "backsheared anvil". Storms having such anvils can arise in weak winds, of course, but when the winds aloft are strong, as is typical in supercell events, this development is an indicator of significant updraft speed.
The notion of an overshooting top was not new when TIP began, but it became clear from storm chasing that storms with persistent overshooting tops are likely to be supercells. Accumulation of cloud material at the equilibrium level from the collapse of overshooting tops can occur with almost any thunderstorm. It's a normal part of deep, moist convection. However, storms with sustained large overshooting are much more likely to be supercells. Also, the strong divergence at storm top can produce the so-called "knuckles" under the anvil, which are another indication of that powerful storm top divergence produced by the collapse of overshooting convective bubbles.
Strong updrafts are much less tilted from the vertical by the typically strong vertical wind shear in supercell environments. Whereas early convective towers may be noticeably tilted away from the vertical, a supercell's updraft is typically more nearly upright in the face of that wind shear. A so-called "vertical wall" of intense updraft seen from a distance is an indication of a possible supercell.
7.2. Medium-range observations
When approaching a severe storm from a distance, it can be difficult to make out features of interest. At a long distance, the features of interest might well be below the horizon. Also, when coming toward a storm from the east, the glare of the afternoon sun makes it difficult to see much. A "moment of truth" is possible once the chase team is beneath the shade produced by the storm's anvil. Under the right circumstances, such a time permits the first look at storm features at cloud base beneath the anvil. Depending on the direction of approach, this may give the chasers their first look at the storm's updraft base. Depending on the perspective, this might allow the identification of wall clouds, beaver's tails, visual vaults, rear flank downdraft "cuts" into the updraft base, and so on. From the visual appearance of the accessory cloud structures, it is possible to determine if the storm is outflow-dominated - when the accessory cloud slopes downward, away from the main precipitation cascade, it's likely to be a "shelf"-like arcus cloud, indicative of outflow dominance. On the other hand, when the accessory cloud slopes upward, away from the precipitation cascade, it's likely to be a "tail" cloud leading into a wall cloud, indicating a powerful updraft.
Updrafts that take on a "bell-shape" morphology are usually associated with supercells. These updrafts may have one or more obvious inflow bands, and may (not always) have a prominent "flanking line" of convective towers on their inflow flank, as well. Another inflow feature are long, laminar, and more or less "cigar-shaped" inflow clouds.
A "bell-shaped" supercell, with a flared-out base - the main precipitation area is to the right.
The angle of approach is very important in terms of being able to observe the structural and accessory cloud features. From some directions, the precipitation cascade of an approaching storm masks the view of the "action area" of a supercell storm. Another factor is the presence of intervening haze and middle cloud and low cloud layers around the updraft. On the Great Plains, a positive feature for storm chasing is the typical absence of such obstructions to visibility from most angles of approach around a supercell.
It also became clear after the first years of TIP operation that approaching a storm by penetrating its main precipitation core was a hazardous tactic. Being generally on the north side of a supercell (in the Northern Hemisphere!) is to be in a poor position, tactically. To avoid "core punching" one must either drop southward well ahead of the approaching precipitation, or wait until the storm passes east of the team. In the latter case, getting south of the storm and then attempting to chase it from behind (a "stern" chase) is not often successful if the storm is moving more than about 30 mph. Chase tactics evolved to put a great deal of emphasis on maneuvering to avoid the necessity for core punching or stern chasing.
The concept of a supercell "spectrum" (Doswell et al. 1990, Doswell and Burgess 1993) based on the distribution of precipitation within and around the mesocyclone began to emerge from the early years of storm chasing. At one extreme was the low-precipitation (LP) supercell, with little or no precipitation visible and perhaps not much on radar, either. At the other extreme was the high-precipitation (HP) supercell, with considerable precipitation wrapping around the back side of the mesocyclone. In between was the "classic" (CL) supercell, with only light precipitation, if any, visible around the mesocyclone. In the early years, this spectrum had not yet been articulated, but the observations of chase teams was already suggesting that this variability of the precipitation within and around the mesoscylone was present in what were clearly all storms with mesocyclones (made evident by the appearance of the clouds and confirmed by their Doppler radar-observed radial velocity fields).
The notion of the wall cloud, a term first coined by Fujita (1960), became the cornerstone of storm spotter training programs growing out of the early years of TIP. This precursor feature to a tornado was thought to be an important factor that would allow a spotter to anticipate the occurrence of a tornado. This has since proved to be somewhat problematic, as spotters have a tendency to see any lowering of cloud base as a wall cloud, and therefore construed to imply enhanced tornado potential. Unfortunately, cloud base lowerings are far more common than are true, rotating wall clouds that are possible tornado precursors. This has been the subject of some revised spotter training material, but with the hindsight of the present (2008), it might be said that too much emphasis was put at first on the wall cloud. Time will tell, of course.
7.3 Tornado observations
Storm chasing has confirmed quite a bit (but not all) of what Fred Bates said (see above) about the life cycle of tornadoes, and added some things, as well. See Golden and Purcell (1977) for more details. The limited photogrammetry that was done has put an end to speculation about very high windspeeds (500 mph or more) in tornadoes. The peak rotational velocities are in the neighborhood of 300 mph, and most tornadic windspeeds are considerably less than that.
Very high vertical velocities near the surface (as found in Hoecker 1960), with vertical accelerations exceeding one gravity - upwards - have been found. It's unfortunate that more detailed photogrammetric analysis of tornado films and video has not been done. To a large extent, this mission is being taken over by mobile Doppler radars (and lidars). The technology of doing photogrammetric analysis of film and video in meteorology has been at a standstill, although photogrammetry per se has not been. This continues to be an untapped mine of potentially valuable information, given the proliferation of video in the years since scientific chasing began.
Although it appeared for a time - immediately following the Union City event of 1973 - that tornadogenesis was a mystery seemingly on the verge of being understood, it has remained resistant to generalization. In fact, chasing has added considerably to the discussion of just what is a tornado, in the first place - despite what Lilly has said, it isn't always possible to identify tornadoes. It seems that there could be several types of phenomena that have different origins but would legitimately be considered tornadoes. The phenomena of "gustnadoes" and "horseshoe vortices" have been discovered by chasing (see Doswell and Burgess 1993), and it's becoming clear that the atmosphere simply produces vortices of various sizes and characteristics. We humans struggle to classify what the atmosphere produces, but in the end, our categories are arbitrary and might be without physical significance. Until we have a thorough quantitative and qualitative dynamical understanding of atmospheric convective vortices, this is going to be a continuing issue. Nevertheless, there are some interesting observations:
The work of TIP and similar projects is clearly an important prelude to the VORTEX Project of 1994-1995 (Rasmussen et al. 1994), and subsequent mobile field observation efforts aimed at supercells and tornadoes. These early observations, coupled with dramatic developments occurring at about the same time in computer simulations of thunderstorms and in Doppler radar, formed the basis for the VORTEX project. The fact that VORTEX results indicated that the existing ideas were seriously flawed is not a problem with the science flowing from the early intercept efforts -- science is most active and exciting when it's clear that existing ideas need to change. The early efforts swept aside some older notions as well as embracing other, earlier ideas. The same is true for VORTEX and its successor projects. Ideas in science are perishable, with new ones superceding some ideas and incorporating some of the pre-existing notions. This is the path of scientific progress. I'm proud to have been associated with these early efforts to collect field observations of storms and continue to believe that it would be difficult to consider myself an "expert"* on an atmospheric phenomenon I'd never seen with my own eyes. Through storm chasing over the years, I've seen a lot of tornadoes, but I've also seen many other types of storms, so a context is emerging by which tornadoes can properly be understood. That's been one of my professional goals from the very beginning of my career.
__________________
* An "Ex" is a has-been, and a "spurt" is a drip under pressure.
Alberty, R.L., et al. 1977: Spring Program ’76. NOAA Tech. Memo. ERL NSSL 78 [NTIS Accession No. PB280745], 130 pp.
Auer, A.H., and J.D. Marwitz, 1972: Hail in the vicinity of organized updrafts. J. Appl. Meteor., 11, 748-751.
Barnes, S.L., 1974: Papers on Oklahoma thunderstorms, April 29-30, 1970. NOAA Tech. Memo. ERL NSSL 69 [NTIS Accession No. COM-74-11474/AS], 147 pp.
Bates, F.C., 1962: Tornadoes of the central United States. Trans. Kansas Acad. Sci,, 65, 215-246.
______, 1963: An aerial observation of a tornado and its parent cloud. Weather, 18, 12-18.
______, 1967: A general theory of thunderstorms. Preprints, 5th Conf. Severe Local Storms (St. Louis, MO), Amer. Meteor. Soc., 28-37.
Brown, R.A., et al., 1976: The Union City, Oklahoma tornado of 24 May 1973. NOAA Tech. Memo. ERL NSSL 80 [NTIS Accession No. PB-269443/AS], 235 pp.
Browning, K.A., and F.H. Ludlam 1962: Airflow in convective storms. Quart. J. Roy. Meteor. Soc., 88, 117-135.
______, and R.J. Donaldson, 1963: Airflow and structure of a tornadic storm. J. Atmos. Sci., 20, 533-545.
______, J. Hallett, T.W. Harrold, and D. Johnson, 1968: The collection and analysis of freshly fallen hailstones. J. Appl. Meteor., 7, 603-612.
Chappell, C.F., 1957: The importance and analysis of the surface chart in severe weather forecasting. Unpublished manuscript, U.S. Wea. Bur., 16 pp.
Davies, J.M., and R.H. Johns, 1993: Some wind and instability parameters associated with strong and violent tornadoes. The Tornado: Its Structure, Dynamics, Prediction, and Hazards, Geophys. Monogr., No. 79, Amer. Geophys. Union, 573-582.
Davies-Jones, R., R.J. Trapp, and H.B. Bluestein, 2001: Tornadoes and tornadic storms. Severe Convective Storms, Meteor. Monogr., 28, No. 50, Amer. Meteor. Soc., 167-221.
Doswell, C.A. III, 1977a: Subsynoptic scale dynamics of severe local storms: A case study. Preprints, 10th Conf. Severe Local Storms (Omaha, NE), Amer. Meteor. Soc., 511-514.
______, 1977b: Obtaining meteorologically significant surface divergence fields through the filtering property of objective analysis. Mon. Wea. Rev., 105, 885-892.
______, 1987: The distinction between large-scale and mesoscale contribution to severe convection: A case study example. Wea. Forecasting, 2, 3-16.
______, 2001: Severe convective storms -- An overview. Severe Convective Storms, Meteor. Monogr., 28, No. 50, Amer. Meteor. Soc., 1-26.
______, and D.W. Burgess, 1993: Tornadoes and tornadic storms: A review of conceptual models. The Tornado: Its Structure, Dynamics, Hazards, and Prediction. Geophys. Monogr., No. 79, Amer. Geophys. Union, 161-172.
______, A.R. Moller, and R. Przybylinski, 1990: A unified set of conceptual models for variations on the supercell theme. Preprints, 16th Conf. Severe Local Storms (Kananaskis Park, Alberta), Amer. Meteor. Soc., 40-45.
______, R.H. Johns, and S.J. Weiss, 1993: Tornado forecasting: A review. The Tornado: Its Structure, Dynamics, Hazards, and Prediction , Geophys. Monogr, No. 79, Amer. Geophys. Union, 557-571.
Donaldson, R.J., Jr., A.A. Spatola, and K.A. Browning, 1965: Visual observations of severe weather phenomena. AFCRL Special Report No. 32 (K.A. Browning, ed.): A family outbreak of severe local storms -- A comprehensive study of the storms in Oklahoma on 26 May 1963, Part I, U.S. Air Force Office of Aerospace Research [NTIS #AD 623787], 73-97.
Fujita, T., 1960: A detailed analysis of the Fargo tornadoes of June 20, 1957. Wea. Bur. Res. Paper, No. 42, Washington, D.C., 67 pp.
______, 1974: Jumbo tornado outbreak of 3 April 1974. Weatherwise, 27, 116-119.
______, D.L. Bradbury, and C.F. Van Thullenar, 1970: Palm Sunday tornadoes of April 11, 1965. Mon. Wea. Rev., 98, 29-69,
Galway, J.G. 1975: Relationship of tornado deaths to severe weather watch areas. Mon. Wea. Rev., 103, 737-741.
______, 1977: Some climatological aspects of tornado outbreaks. Mon. Wea. Rev., 105, 477-484.
Golden, J.H., 1974: The life cycle of Florida Keys' waterspouts. J. Appl. Meteor., 13, 676-692.
______, and B.J. Morgan, 1972: The NSSL-Notre Dame tornado intercept program, spring 1972. Bull. Amer. Meteor. Soc., 53, 1178-1180.
______, and D. Purcell, 1977: Photogrammetric velocities for the Great Bend, Kansas tornado of 30 August, 1974: Accelerations and asymmetries. Mon. Wea. Rev., 105, 485-492.
Hoecker, W.H., Jr., 1960: Wind speed and air flow patterns in the Dallas tornado of 02 April 1957. Mon. Wea. Rev., 88, 167-180.
______, R.G. Beebe, D.T. Williams, J.T. Lee, S.G. Bigler, and E.P. Segner, Jr., 1960: The tornadoes at Dallas, Tex., April 2, 1957 Wea. Bur. Res. Paper, No. 41, Washington, D.C., 175 pp.
Johns, R.H., and C.A. Doswell III, 1992: Severe local storms forecasting. Wea. Forecasting, 7, 588-612.
______, J.M. Davies, and P.W. Leftwich, 1993: Some wind and instability parameters associated with strong and violent tornadoes. 2. Variations in the combinations of wind and instability parameters. The Tornado. Its Structure, Dynamics, Prediction, and Hazards. Geophys. Monogr., No. 79, Amer. Geophys. Union, 583-590.
Kessler, E., 1970: Tornadoes. Bull. Amer. Meteor. Soc., 51, 926-937.
Klemp, J.B., and R.B. Wilhelmson, 1978: The simulation of three-dimensional convective storm dynamics. J. Atmos. Sci., 35, 1070-1096.
Lemon, L.R., and C.A. Doswell III, 1979: Severe thunderstorm evolution and mesocyclone structure as related to tornadogenesis. Mon. Wea. Rev., 107, 1184-1197.
Lilly, D., 1969: Tornado dynamics. NCAR Manuscript 69-177, available from NCAR, P.O. Box 3000, Boulder, CO 80307.
______, 1976: Sources of rotation and energy within the tornado. Proceedings, Symp. on Tornadoes: Assessment of Knowledge and Implications for Man, Lubbock, TX, Texas Tech. University, 145-150.
Magor, B.W., 1959: Mesoanalysis: Some operational analysis techniques utilized in tornado forecasting. Bull. Amer. Meteor. Soc., 40, 499-511.
Maddox, R.A., L.R. Hoxit, and C.F. Chappell, 1980: A study of tornadic thunderstorm interactions with thermal boundaries. Mon. Wea. Rev., 108, 322-336.
______, and C.A. Doswell III, 1982a: An examination of jetstream configurations, 500 mb vorticity advection and low level thermal advection patterns during extended periods of intense convection. Mon. Wea. Rev., 109, 184-197.
______, and C.A. Doswell III, 1982b: Forecasting severe thunderstorms: A brief consideration of some accepted techniques. Nat. Wea. Dig., 7, No. 2, 26-30.
Martner, B.E, 1977: A field experiment on the calibration of radars with raindrop disdrometers. J. Appl. Meteor., 16, 451-454.
Miller, R.C., 1972: Notes on analysis and severe-storm forecasting procedures of the Air Force Global Forecasting Center. Air Weather Service Tech. Rep. 200 (rev.), Air Weather Service Headquarters, Scott AFB, IL, 190 pp.
Moller, A.R., 1979: The climatology and synoptic meteorology of Southern Plains’ tornado outbreaks. M.S. Thesis, University of Oklahoma. 70 pp.
______, 2001: Severe local storms forecasting. Severe Convective Storms, Meteor. Monogr., 28, No. 50, Amer. Meteor. Soc., 433-480.
______, C.A. Doswell III, J. McGinley, S. Tegtmeier, and R. Zipser, 1974: Field observations of the Union City tornado in Oklahoma. Weatherwise, 27, 68-77.
Monteverdi, J.P., C.A. Doswell III, and G.S Lipari, 2003: Shear parameter thresholds for forecasting tornadic thunderstorms in northern and central California. Wea. Forecasting, 18, 357-370.
Morton, B., 1966: Geophysical vortices. Progress in Aeronautical Sciences, 7, Pergamon Press, 146-193
Newton, C.W., 1963: Dynamics of severe convective storms. Severe Local Storms, Meteor. Monogr., 5, No. 27, Amer. Meteor. Soc., 33-58.
______, 1966: Circulations in large, sheared cumulonimbus. Tellus, 18, 699-712.
Nolen, R.H., 1959: A radar pattern associated with tornadoes. Bull. Amer. Meteor. Soc., 40, 277-279.
Ostby, F.P., 1975: An application of severe storm forecast techniques to the outbreak of June 8, 1974. Preprints, 9th Conf. Severe Local Storms (Norman, OK), 7-12.
Pearson, A., and S.J. Weiss, 1979: Some trends in forecast skill at the National Severe Storms Forecast Center. Bull. Amer. Meteor. Soc., 60, 319-405.
Rasmussen, E.N., J.M. Straka, R. Davies-Jones, C.A. Doswell III, F.H. Carr, M.D. Eilts and D.R. MacGorman, 1994: Verification of the Origins of Rotation in Tornadoes EXperiment (VORTEX). Bull. Amer. Meteor. Soc., 75, (995-1006).
Rhea, J.O., 1966: A study of thunderstorm formation along drylines. J. Appl. Meteor., 5, 58-63.
Schlesinger, R.E. 1975: A three-dimensional numerical model of an isolated deep convective cloud: Preliminary results. J. Atmos. Sci., 32, 934-957.
Siebers,J.O., F. Hidalgo, S.A. Tegtmeier, and M. Young, 1975: Guide for using GOES/SMS imagery in severe weather forecasting. USAFETC, Andrews AFB, MD, 56 pp.
Tegtmeier , S., 1974: The role of the subsynoptic low pressure system in severe weather forecasting. M.S. Thesis, University of Oklahoma, 66 pp.
Ward, N.B., 1961: Radar and surface observations of tornadoes on May 4, 1961. Proceedings, 9th Weather Radar Conf. (Kansas City, MO), Amer. Meteor. Soc., Boston, 175-180.
Weisman, M.L., and J.B. Klemp, 1982: The dependence of numerically simulated convective storms on vertical wind shear and buoyancy. Mon. Wea. Rev, 110, 504-520.
______, and ______, 1984: The structure and classification of numerically simulated convective storms in directionally varying wind shears. Mon. Wea. Rev, 112, 2479-2498.
Whiting, R.M., and R. E. Bailey, 1957: Some meteorological relationships in the prediction of tornadoes. Mon. Wea. Rev., 85, 141-150.
Wilk, K., et al., 1976: Objectives and accomplishments of the NSSL 1975 Spring Program. NOAA Tech. Memo. ERL NSSL 78 [NTIS Accession No. PB-263813/AS], 47 pp.
Shortly after organized scientific storm chasing began in 1972, it became clear that the existing terminology for cloud forms was not very useful. Storm chasers have developed a large "vocabulary" of colloquial terms to denote various cloud features. The goal here is not be comprehensive but to provide brief definitions of what I believe are the most commonly-used terms.
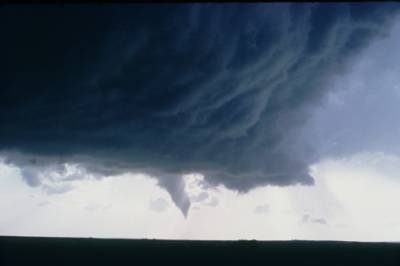
Wall cloud - an abrupt local lowering of cloud base (Fujita 1960), typically a few km in diameter or less. A tornadic wall cloud is usually characterized by strong cyclonic rotation. Many non-rotating lowerings are seen in association with thunderstorms and so are not generally considered to be true wall clouds. Some call this a pedestal cloud (Auer 1970, Fankhauser et al. 1986), but this term is not widely accepted.
Collar cloud - a ring of cloud surrounding the upper portion of a wall cloud, where it joins the general cloud base (Fujita 1960).
Tail cloud - a low, tail-shaped cloud extending from the wall cloud toward the main precipitation region of a storm. Motions along the tail cloud are generally from the precipitation area toward the wall cloud.
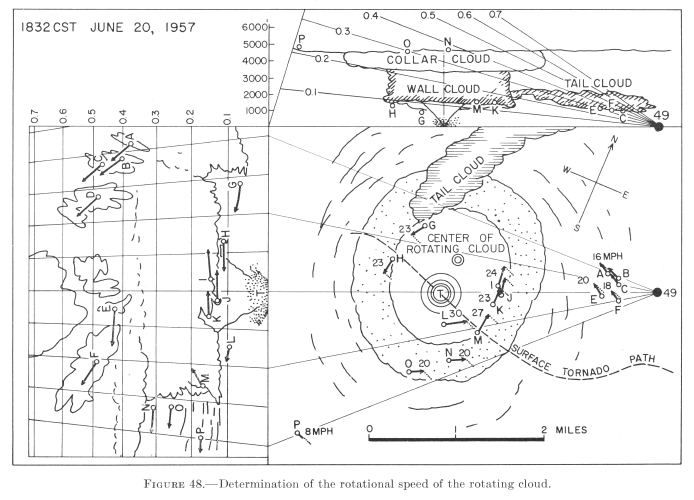
Schematic (top) from Fujita (1960) showing the cloud structures: wall, collar, and tail clouds and (bottom) scaled images with fill-in sketches of the actual Fargo storm, illustrating these cloud features.
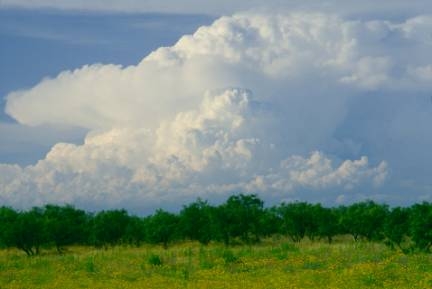
Flanking line - a line of cumulus congestus connected to
and extending outward from the main storm tower The base of
this cloud line is that from which a wall cloud is attached.
Example of a flanking line on 20 April 1974. Photograph © 1974 C. Doswell
Main storm tower - the primary updraft column of a
cumulonimbus, distinguished from developing updrafts in a flanking
line, usually located in the right rear portion of the radar echo.
Example of a multicell storm on 01 June 1992, with the main storm tower in the background, under the tallest storm top. Photograph © 1992 C. Doswell
Beaver's tail - another tail-shaped cloud, but one
associated with the same cloud base as the flanking line, not
that of the wall cloud. This feature is not always present, but when
it is, the flow is along the cloud line, toward the main storm
tower.
Example of a beaver's tail associated with a supercell on 14 April 1973, extending toward the right side of the image. Photograph © 1973 John McGinley
Visual vault - a gap that is not always present, but is
seen when the main storm tower is visually separated from the
precipitation region.
Example of a visual vault on the right hand side of the image between the precipitation and the updraft tower on 18 June 1973. A beaver's tail is also present on the right hand side. Photograph © 1973 C. Doswell
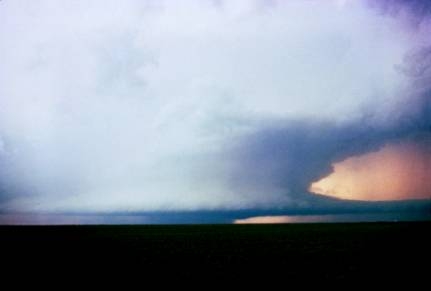
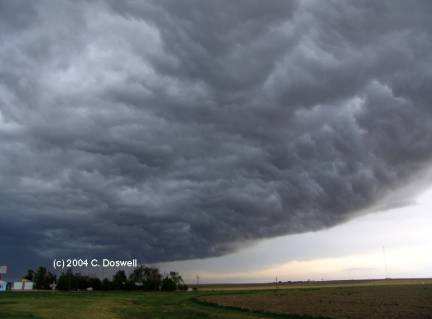
Shelf cloud - an arcus cloud attached to the general cloud
base, delineating the boundary between ascent and descent along the
leading edge of a storm's outflow. Browning (1977) uses this term to
describe the general flat cloud base of the cumulonimbus, but this
use of the term is not widely accepted.
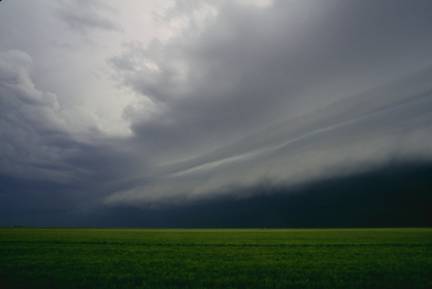
Example of a shelf cloud, advancing from right to left, on 23 May 1991. Photograph © 1991 C. Doswell
Roll cloud - an arcus cloud that is more or less
cylindrical and is completely detached from the general cloud base.
It may be rotating about a horizontal axis, with upward motion on the
forward edge and downward motion behind. This type of accessory cloud
is often seen on the boundaries of the outflow left behind by a
convective storm.
Example of a roll cloud at the bottom of the image, in May of 1978. Photograph © 1978 C. Doswell
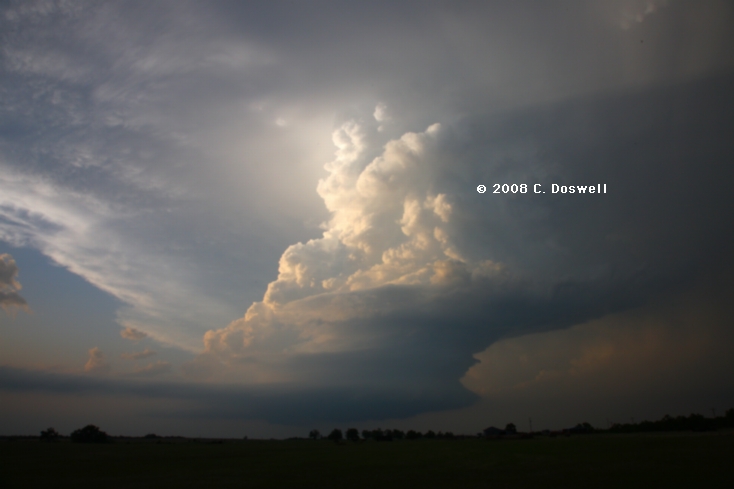
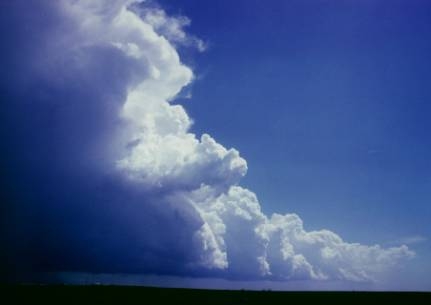
Backsheared anvil - an anvil that extends upshear from the
main storm tower, indicative of strong divergence at the storm top.
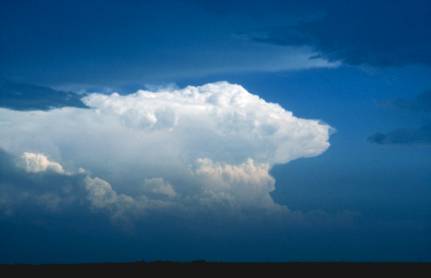
Example of a "backsheared" anvil on 14 May 1990. Note also the large overshooting top. Photograph © 1990 C. Doswell
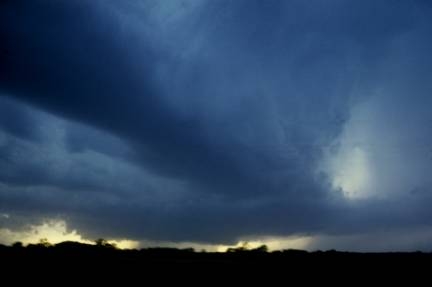
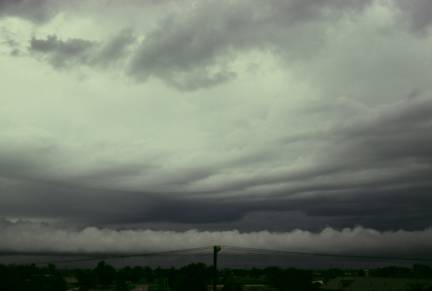
Whale's mouth - the backside of an arcus cloud, in
between the leading edge of the outflow and the precipitation.
Example of the so-called “whale's mouth” structure on the backside of an outflow. This is behind a shelf cloud, which passed earlier and is moving from left to right. Photograph © 2004 C. Doswell